

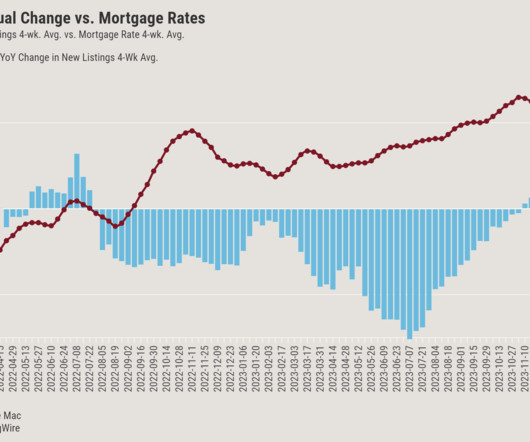
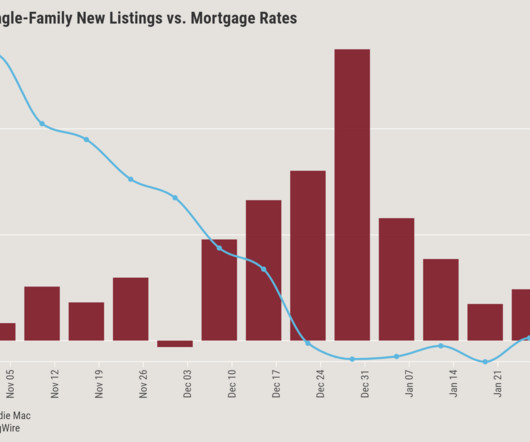
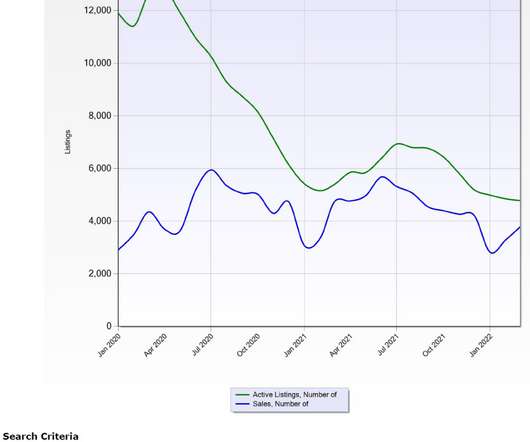
New Listings Return to 2019 Levels
Appraisal Buzz
JULY 9, 2021
The sizzling seller’s market shows some signs of cooling, but, according to analysts, “only by a few degrees.” ” The post New Listings Return to 2019 Levels appeared first on DSNews. The post New Listings Return to 2019 Levels appeared first on Appraisal Buzz.


Let's personalize your content