
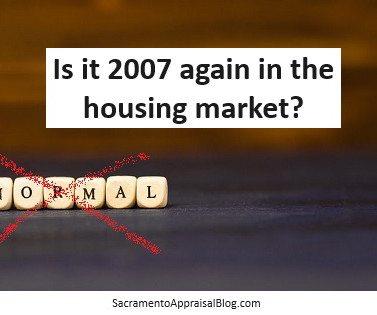
Is it 2007 again in the housing market?
Sacramento Appraisal Blog
SEPTEMBER 12, 2023
Is it 2007 again? There’s so much talk online about today’s housing market being like 2007, but what are the stats showing? Today I want to walk through three parts of the market. UPCOMING (PUBLIC) SPEAKING GIGS: […] The post Is it 2007 again in the housing market?


Let's personalize your content