
Will mortgage rates break toward 8% again, making another 2024 data line that looks like a carbon copy of 2023? It’s not part of my 2024 forecast, but since the Federal Reserve likes playing with fire, let’s look at where we are with mortgage rates and their impact on weekly housing data.
Mortgage rates and the 10-year yield
The 10-year yield is the key for housing in 2024. In my 2024 forecast, I put the 10-year yield range between 3.21%-4.25%, with a critical line in the sand at 3.37%. If the economic data stays firm, we shouldn’t break below 3.21%, but if the labor data gets weaker, that line in the sand — which I call the Gandalf line, as in “you shall not pass” — will be tested.
This 10-year yield range translates to mortgage rates between 5.75%-7.25%, but this assumes spreads are still bad. The spreads have been improving this year so much that if we hit 4.25% on the 10-year yield, we still won’t see 7.25% in mortgage rates. As we saw last week, I already got this wrong in 2024 because we got above 4.25% on the 10-year yield and peak mortgage rate pricing was 7.14%. This means the spreads are acting better in 2024 than I had anticipated.
Serious mortgage rate talk!
We are approaching a critical technical level on the 10-year yield that can cause market drama for mortgage rates. For those who have followed my Instagram story videos for over a year, the essential level of 4.34% is getting close to being tested again. If we break above this level, bond traders can sell bonds and take the 10-year yields much higher if the Fed doesn’t step in.
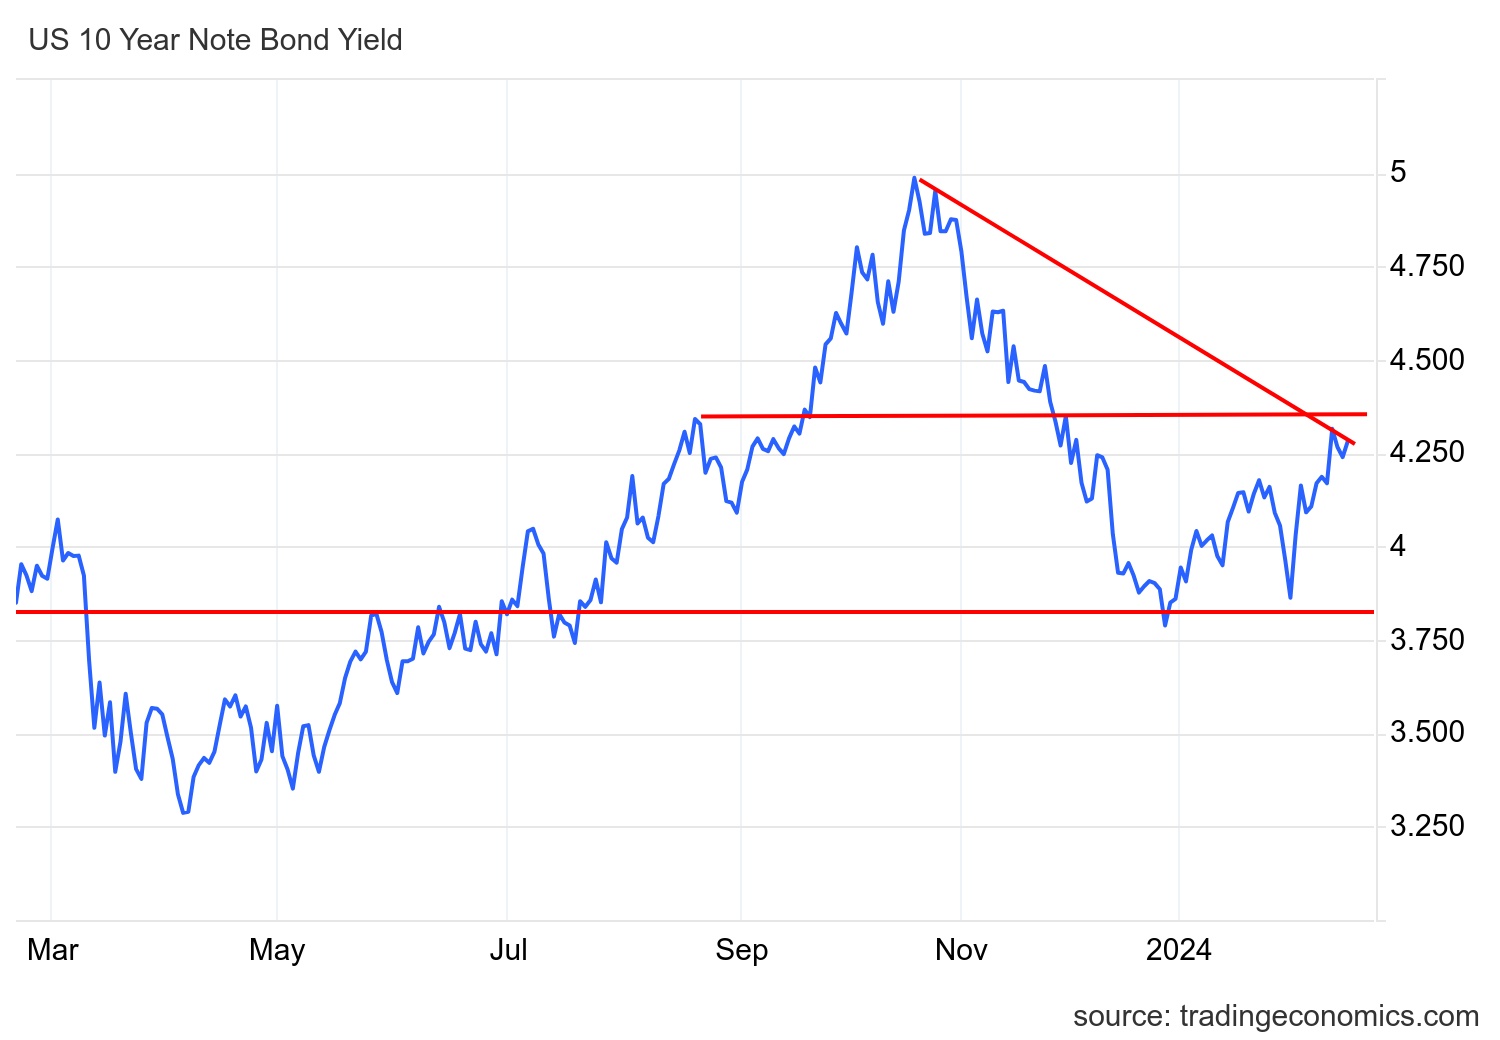
The Fed has said they don’t want this to happen because policy would be too restrictive, but short-term bond traders don’t care. It was good to see Fed Governor Waller try to push back on the recent move in yields last week, but playing with fire here is not the best thing for the Fed. We have bounced from the 3.80% area twice, once in late 2023 and early 2024. This year we have mostly stayed between 3.80%-4.25% — this isn’t surprising, especially with low jobless claims data.
Jobless claims data, to me, is the most critical data line for rates to go lower in 2024, and it’s been firm so far this year. However, the 10-year yield above 4.34% is not part of the 2024 forecast, and if that happens, look again for Fed members to try to talk the bond market down again if this escalates to a 5% 10-year yield and 8% mortgage rates. The chart below looks at the 10-year yield, and the horizontal lines show why 3.80% and 4.34% are key levels, especially when looking at the downtrend from 5%.
Weekly housing inventory data
The best part of 2024 for me is watching housing inventory grow year-over-year. As we can see below, we are more than double the lows we saw in March of 2022, when I had already deemed the housing market savagely unhealthy. We should see the seasonal bottom soon and then the traditional increase in active inventory to match the growth in new listings data. This also assumes that new listing data stays on its path for growth year over year.
Here is a look at last week:
- Weekly inventory change (Feb. 9-16): Inventory fell from 494,862 to 494,029
- Same week last year (Feb. 10-17): Inventory fell from 444,129 to 437,282
- The recent inventory bottom was in 2022 at 240,194
- The inventory peak for 2023 was 569,898
- For context, active listings for this week in 2015 were 954,581
New listings data
New listings data saw a week-to-week decline, but it is still up year over year. Mortgage rates have been increasing lately, and I am always mindful that some people will not list their homes to sell and buy another one if rates jump on them. Last year, the data was very steady, even with mortgage rates heading toward 8%. However, 2023 was the lowest new listings data pool ever, which was an unhealthy outcome.
Weekly new listing data for the last week over the previous several years:
- 2024: 49,559
- 2023: 42,073
- 2022: 48,979
Price-cut percentage
Every year, one-third of all homes take a price cut before selling — this is a traditional housing activity that happens every year. However, this data can move stronger in either direction when mortgage rates rise or fall aggressively.
The year-over-year price data has been stabilizing since Nov. 9, 2022. Even with 8% rates last year, the data was negative year over year and we are still showing a decline year over year. However, the gap is narrowing, and the seasonal inventory increase will happen soon. Here are the price cut percentages for last week over the last several years:
- 2024: 30%
- 2023: 31.3%
- 2022: 18.3 %
Purchase application data
Higher mortgage rates are already impacting the purchase application data with three straight negative weekly prints, and rates went higher again last week. Now, while home sales aren’t crashing and we will see a bounce in sales in the following existing home sales report, the forward-looking data isn’t showing growth. As I have stated time and time again, the Fed and the government have a COVID-19 housing economy policy, and keeping sales depressed is in their interest, something I talked about last year on CNBC.
Since November of 2023, we have had eight positive and three negative prints after making holiday adjustments. Year to date, we have had two positive prints versus three negative prints. I know some people have said the last two weeks show positive weekly data, but they are looking at the unadjusted numbers weekly data; we don’t count that.
The week ahead: Existing home sales, jobless claims and Fed talking pointsThis week we will have the existing home sales report and the leading economic index. We will see a bounce in existing home sales, but it won’t be like in 2023, when sales rose to 4.55 million. Fed Governor Michelle Bowman might come out with some absolute hawkish statements, so keep an eye out on Wednesday when she talks. Of course, my crucial data line is jobless claims data, which comes out every Thursday morning.

