
Last week ended with a wild ride for mortgage rates. We anticipated the two inflation reports could help mortgage rates, however, we had a bad bond auction last Thursday, and the 10-year yield rose sharply. Weekly active inventory grew slowly again and purchase apps were down week to week again.
- Weekly active listings rose by only 4,270
- Mortgage rates went from 7.03% to 7.19%
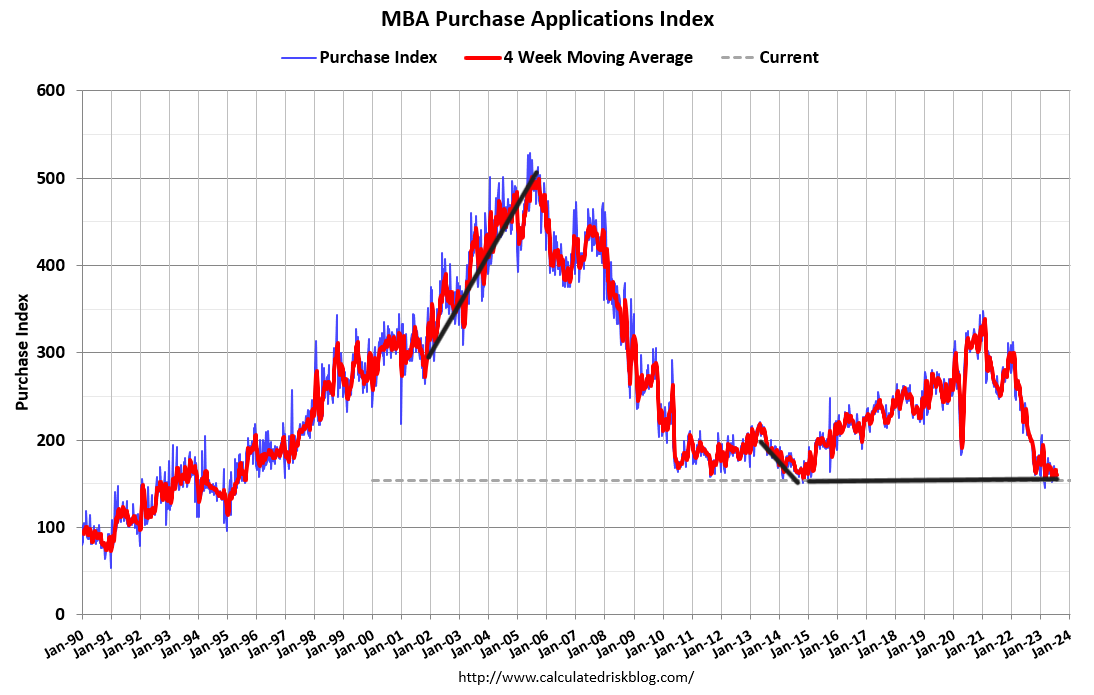
- Purchase apps were down 3% week to week
Mortgage rates and bond yields
Last week we started with lower bond yields as we anticipated inflation reports to continue the trend of slower year-over-year inflation data. This happened as expected, except we had a lousy bond auction, which meant too much debt supply came online with insufficient buyers. This pushed yields higher Thursday and Friday to move mortgage rates to 7.19%.
A valid case for higher mortgage rates in the short term is that we are simply going to be in an environment where we don’t have a lot of bond buyers versus the supply coming in, thus making it harder for mortgage rates to go lower. We saw an example of that last week.
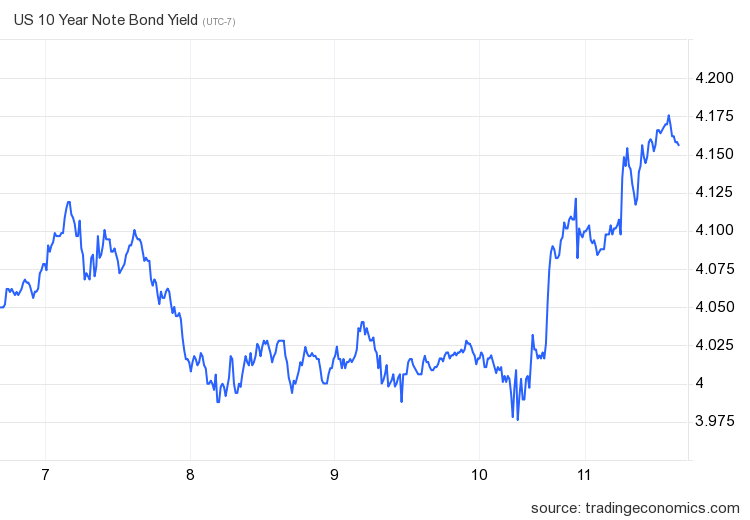
For my 2023 forecast, my range on the 10-year yield has been between 3.21%-4.25%, emphasizing that the bond yields can go lower than 3.21% only if the labor market breaks. The labor market breaking to me is if jobless claims on a four-week moving average go over 323,000; currently, that data is 231,000. As the economy has stayed firm, bond yields are at a higher level of my range for 2023.

Weekly housing inventory
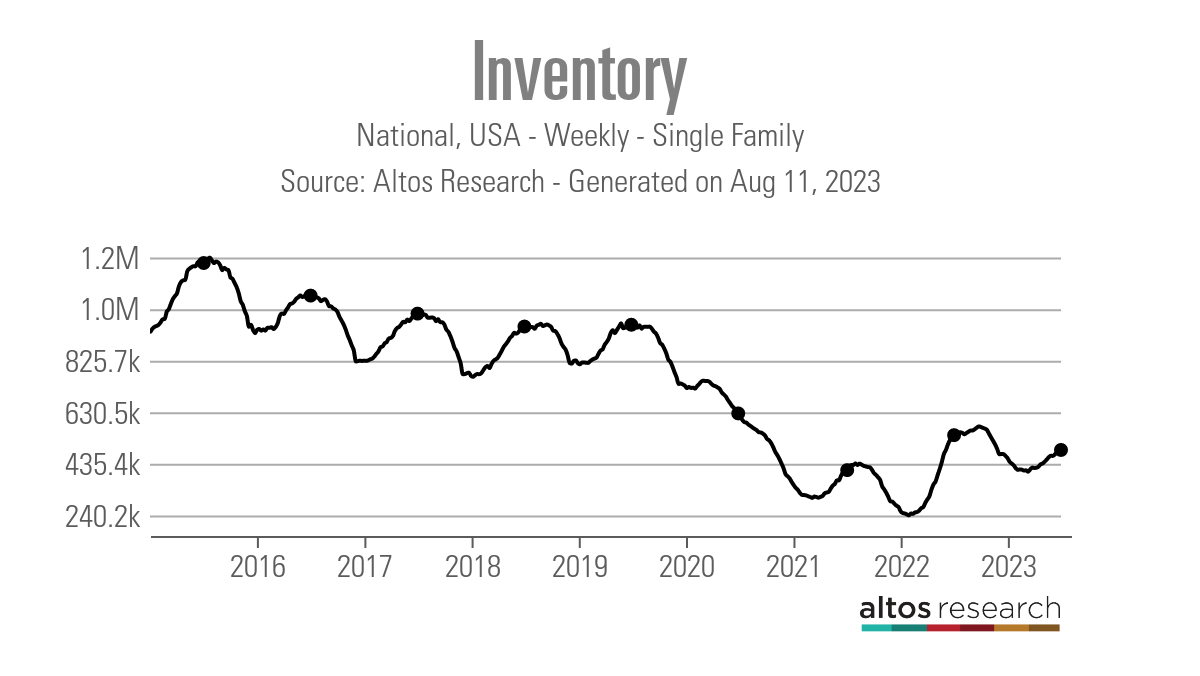
The painful housing inventory story of 2023 continues as we had yet another week of slow inventory growth. Last year when mortgage rates spiked higher, inventory growth was much faster, but we were also working from the lowest levels recorded in history in March of 2022. This year, it’s been a much different story.
- Weekly inventory change (August 4-August 11): Inventory rose from 487,870 to 492,140
- Same week last year (August 5-August 12): Inventory rose from 543,898 to 550,175
- The inventory bottom for 2022 was 240,194
- The inventory peak for 2023 so far is 492,140
- For context, active listings for this week in 2015 were 1,203,577
As we can see in the chart below, inventory growth has been so slow that active listings have been negative year over year for some time now. For those calling for a massive inventory spike since 2008, the last few years have not gone as planned.

New listings data has been trending at the lowest levels recorded in history for more than 12 months. However, even with higher mortgage rates in the last few months, we haven’t seen a new leg lower in this data line, which means we might be forming a workable bottom in 2023. As you can see in the chart below, 2023 has had a clear divergence versus 2021 and 2022 data, which were already at all-time lows before last year.
Here’s how new listings this week compare to the same week in past years:
- 2023: 60,759
- 2022: 73,384
- 2021: 79,184

Purchase application data
Purchase application data was down again by 3% last week, making the count year-to-date at 14 positive and 16 negative prints. If we start from Nov. 9, 2022, it’s been 21 positive prints versus 16 negative prints. Mortgage rates near or above 7% are simply too high to promote real growth in this data line, which is working from a historical bottom.
So, when rates fall, moving the needle higher for purchase apps won’t take much. However, for now, rates this high have facilitated more negative week-to-week data than positive, leading to lower sales as this data line looks out 30-90 days. While we aren’t seeing sales collapse like last year, we aren’t growing sales meaningfully from the recent lows.
The week ahead: Tons of economic data
This week, we have various economic data reports that can move mortgage rates and give us a sense of where the housing market is going. Retail sales and the Leading Economic Index are out this week. Also, we get two key data lines for housing this week: the homebuilders survey by NAHB/Wells Fargo and housing starts!
What I am looking for in housing data is what the builder survey indicates for the next six months. In last month’s report, we saw a slight decline in this data line. For this week, I want to see how mortgage rates react to the batch of new economic data.


Great summary of the current mortgage rate conditions. I always count on Logan’s rational, logical analysis, which cuts through the distractions and economic clutter to drill down to the important facts.
Logan’s passion and commitment to historical housing facts and data, versus opinion or other agendas, and his famous quote of “numbers are the closest thing to the handwriting of God”, are the educational fuel I rely on each and every week to help my partners and clients remain informed and balanced.