Imagine you are a mid-level manager at a fast growing small business. As part of the company’s expansion plans, you have been tasked with finding office space in a new city and deciding whether to lease it or purchase it.
Fortunately, there is an objective way to make this decision. But, it can be a little bit complicated. In this article, we are going to introduce the key concepts in lease vs. own analysis and apply them with a case study.
Lease vs. Own – Reasons for Each
For many, buying a property is automatically assumed to be the best choice. In many cases it may be. Property owners benefit from increases in the asset’s value over time and from the tax benefits of depreciation. In addition, they may benefit from leasing excess space to other tenants, favorable loan interest rates, and the comfort in knowing that their rent isn’t subject to the whims of a landlord.
However, buying a commercial property also requires a significant capital investment in the form of a down payment on the property and in the improvements made to the interior. Depending on the capital needs of the corporation for other projects, it may not always be the best choice.
On the other hand, leasing commercial real estate requires little to no upfront investment. In fact, the landlord may even provide a tenant improvement allowance to fund all or some of the interior buildout. In addition, lease payments are qualified operating expenses so they reduce the company’s taxable income and leasing relieves the company of the burden of property management and does not tie up capital that could be otherwise used to fund growth.
On the downside, there is no opportunity to earn a profit on a lease and lease rates can be subject to change based on the local market and the property owner’s return requirements.
The point is this, there are a variety of equally valid reasons to lease or buy a property. Some of them are based on the company’s specific needs while others are strictly financial. Lease vs. Own analysis tackles the financial aspect only. It can provide an objective outcome from a financial perspective only, but there are considerations that go beyond finances that vary from one company to another.
Lease vs. Own Analysis – Basic Concepts
The basic concept behind lease vs. own analysis is that the cash flows for each option need to be evaluated from both pre-tax and after-tax perspective. There are two ways to do this:
- The Net Present Value (NPV) Method: The NPV approach considers the present value of all future after-tax cash flows and discounts them back to the present time using the investor’s required rate of return. A rational actor would choose the option with the highest NPV.
- The Internal Rate of Return (IRR) Method: This method seeks to perform cost/benefit analysis between the cost of buying the property and the benefits that are received from owning it. The resulting IRR is the rate of return that can be earned from buying rather than leasing the property and it can be compared against other factors like weighted average cost of capital (WACC), required rate of return, and opportunity cost associated with alternative investment options.
While the concept itself is relatively simple, the actual analysis can be much more complex because it needs to incorporate details specific to the transaction like: lease term, potential lenders, property occupancy, property taxes, loan amortization, capital gains, closing costs, loan debt service, income escalations, the property’s purchase price, tax rate, deductible depreciation, and the monthly payments associated with the lease.
Lease vs. Own – A Case Study
To illustrate how business owners can deploy lease vs. own analysis, an example is helpful. We’ll start by setting it up and then go through the calculations.
Case Study Setup
Extending the example from above, assume the small business has found a 10,000 square foot commercial space and they need to evaluate the cost of leasing it versus the cost of purchasing it outright at its current market value. Let’s start with a review of the lease cash flows.
Required Lease Inputs & Analysis
To calculate the Net Present Value (NPV) of the lease payments, the following inputs are required:
- Marginal Tax Rate: 35%
- Discount Rate: 7%
- Improvement Expense: $15,000
- Commercial LeaseRental Rate: $20 Per Square Foot
- Rental Increases: 3% Annually
- Operating Expenses: $6 Per Square Foot
- Operating Expense Increases: 2% Annually
Using Microsoft Excel or a similar spreadsheet program, these inputs can be transformed into the following analysis (NOTE: Only the first 5 years of a 20 year lease is shown):
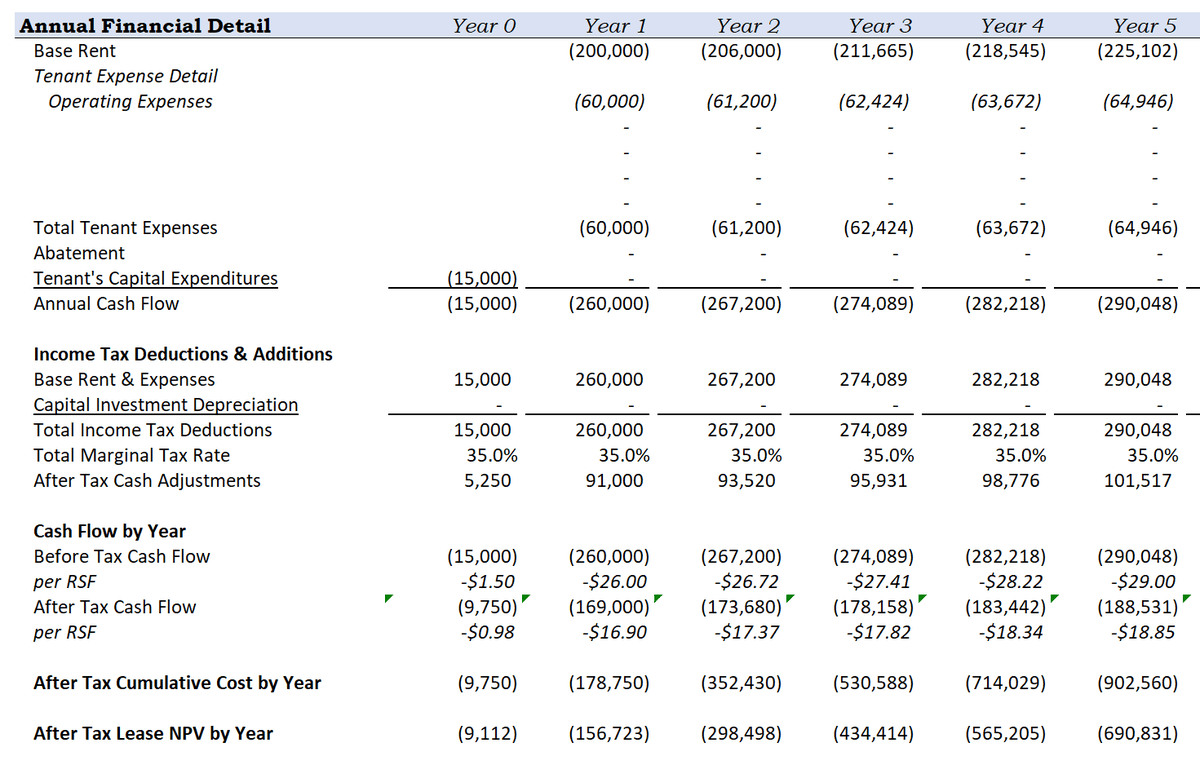
Let’s go through how each line item in the analysis is derived for Year 1 of the lease period:
- Base Rent: Base rent is calculated as the total rentable square feet (10,000) multiplied by the per square foot rental rate ($20). Year 1 outflow is $200,000 and it rises 3% annually.
- Operating Expenses: The tenant is also responsible for operating expenses of $6 PSF, multiplied by 10,000 SF. It rises by 2% annually.
- Capital Expenditures: The tenant is responsible for $15,000 in CapEx in year 0. This is a direct input. There are no further capital expenditures.
- Annual Cash Flow: Equal to the sum of total rent payments plus total expenses (including CapEx). In year 1, it is ($260,000) and it rises in each year of the lease.
- Total Marginal Tax Rate: The company has estimated their own marginal tax rate at 35%. This is a direct input.
- After Tax Cash Adjustments: Remember, monthly rental payments reduce the company’s tax burden. So, there is some tax benefit from the lease and it is calculated as the total outflow ($260,000) multiplied by the marginal tax rate (35%). The benefit is $91,100, meaning this is the tax savings from the rental expense.
- After Tax Cash Flow: Equal to the before tax cash flow (-$260,000) plus the after tax cash adjustment ($91,100). This is the key number in the analysis.
- After Tax Cumulative Cost By Year: This line item is calculated as a running total of the annual after tax cash flows. For example after tax cash flow for year 0 is ($9,750) and ($169,000) for year 1. Together, this is ($178,750). This continues for the analysis period.
- After Tax NPV By Year: This line item is calculated as the cumulative cash flow discounted at the specified rate (7%) for the relevant number of periods.
The Excel model makes these calculations for each year in the analysis period and the after tax cash flow is summarized in the table below:
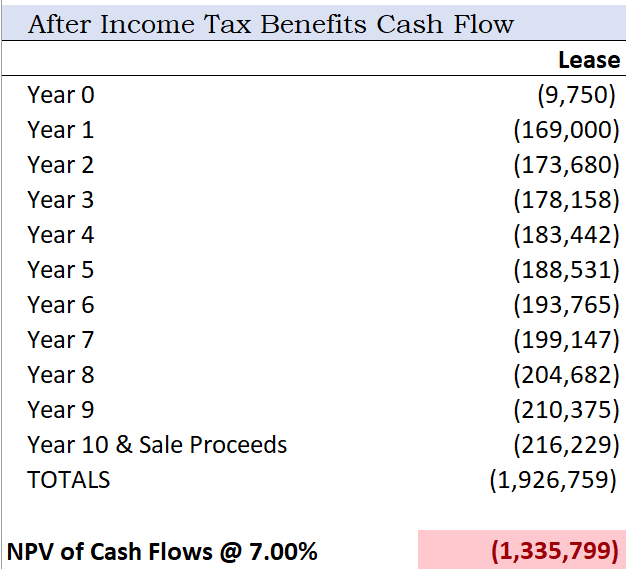
When these cash flows are summed and discounted at 7%, the NPV is ($1,335,799), which represents the present value of the cash outflows associated with the lease payments. We’ll set this number aside for the moment and come back to it shortly.
Required Purchase Inputs & Analysis
The idea for the purchase is the same, to calculate the cash flows from each year of ownership. To do this, the following inputs are required:
- Purchase Price: $5,000,000 (including $200,000 in land value)
- Down Payment: $1,000,000
- Loan Amount: $4,000,000
- Loan Amortization Period: 20 Years
- Interest Rate: 5.50%
- Depreciation Period: 39 Years
- Capital GainsTax Rate: 20%
- Marginal Tax Rate: 35%
- Depreciation Recapture Rate: 25%
- Loan Closing Costs: 1%
- Sale Costs: 4%
- Property Appreciation: 3% annually
- Operating Expenses: $6 PSF, growing at 2% annually
- Other Rent: $20,000 annually (parking fees), growing at 2% annually
Like the lease payments, these cash flows can be modeled in Excel to produce the following output (only the first 5 years shown):
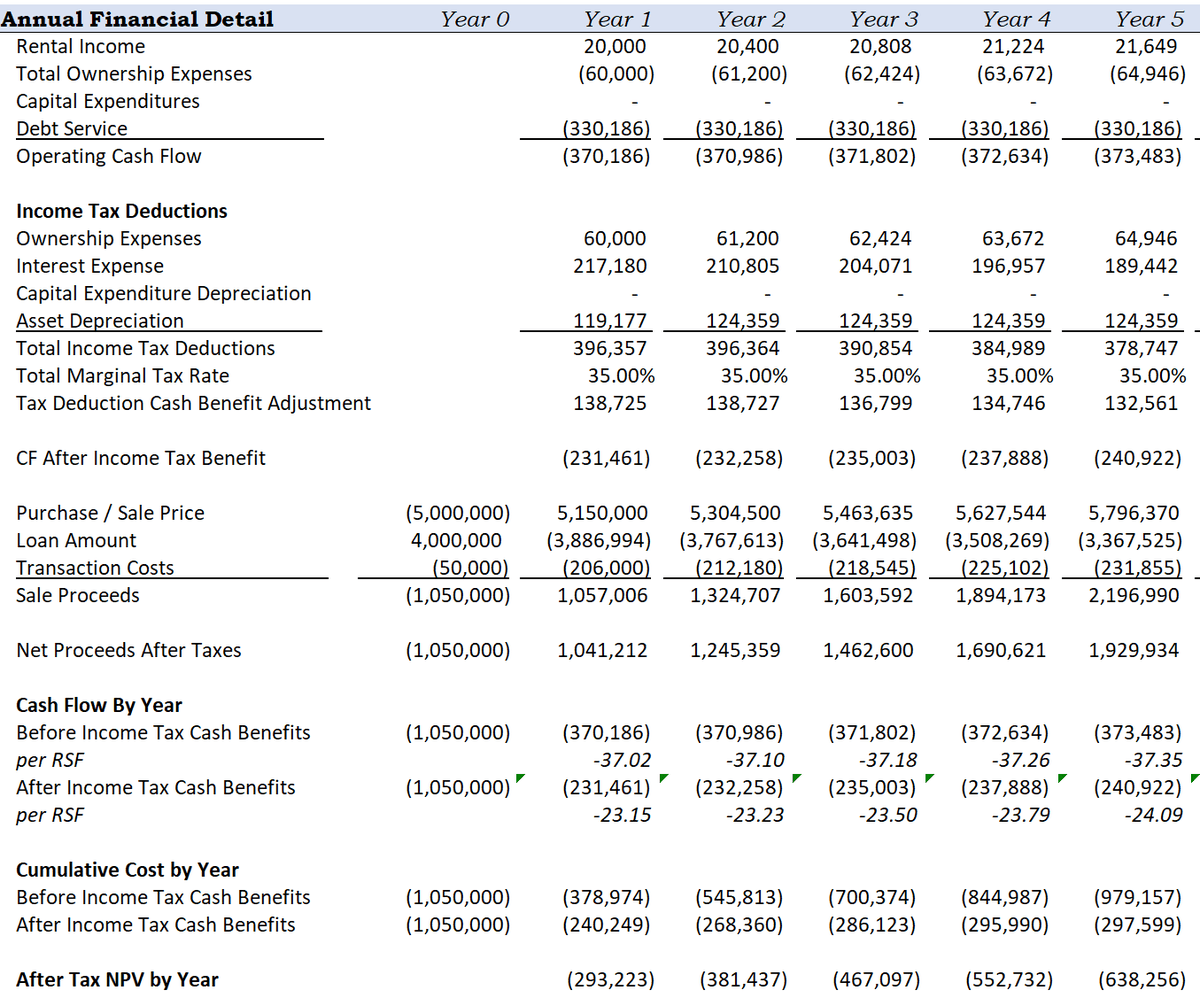
Again, let’s go through how each of the major line items are calculated for year 1 of the analysis period:
- Rental Income: Represents the “Other” rent earned from the parking fees. $20,000 in year 1 and growing at 2% annually.
- Total Ownership Expenses: Calculated as the PSF Operating Expenses of $6 PSF, multiplied by the square footage leased. It increases at 2% annually.
- Debt Service: The estimated loan payment based on the $4,000,000 loan amount, 20 year amortization period, and 5.50% interest rate. It remains fixed at ($330,186) annually.
- Income Tax Deductions: This section of the model focuses on the tax benefits of ownership. Operating expenses of $60,000 are deducted, loan interest expense of $217,180 is also deducted, and the owner is entitled to $119,117 in depreciation (purchase price minus transaction costs, divided by the depreciation period).
- Total Income Tax Deductions: Sum of all Income Tax Deductions
- Total Marginal Tax Rate: This is an input at 35%.
- Tax Deduction Cash Benefit Adjustment: This line item is the total income tax deductions multiplied by the marginal tax rate and it represents the potential tax savings.
- CF After Income Tax Benefit: Equal to operating cash flow plus the cash benefit adjustment.
- Purchase/Sale Price: Represents the potential sales price of the property calculated as the purchase price, multiplied by the annual appreciation of 3%.
- Loan Amount: The loan amount at the end of each year after all principal reductions have been made.
- Transaction Costs: Calculated as the purchase/sale price multiplied by the selling costs of 4%.
- Sale Proceeds: Net cash proceeds after the loan payoff and transaction costs.
- Net Proceeds After Taxes: Total cash proceeds after the taxable gain and depreciation recapture.
- After Tax Cash Benefits: Net annual cash flow after all taxes have been paid. This is the key figure in the sale analysis.
Once the annual after tax cash flows have been calculated for each year in the analysis period, they are summarized in the following table:
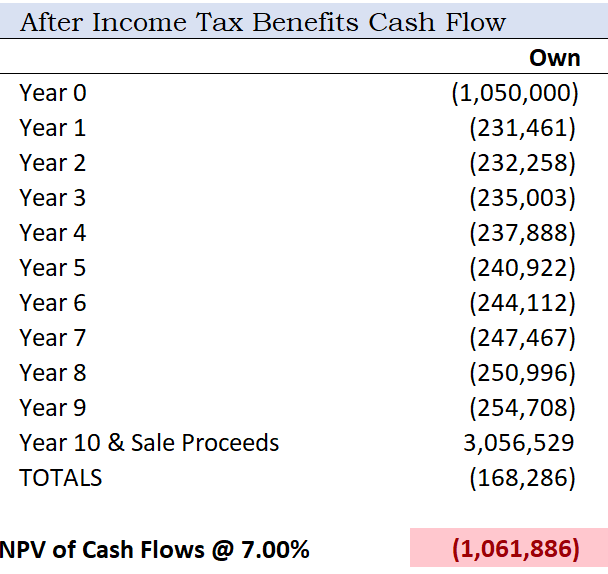
The NPV of ownership cash flows is ($1,061,886). Now, let’s compare the lease cash flows vs. the ownership cash flows.
Lease vs. Own – Comparison
The lease vs. own cash flow can be placed side by side and the IRR of the differential can be calculated. See the table below for a summary.
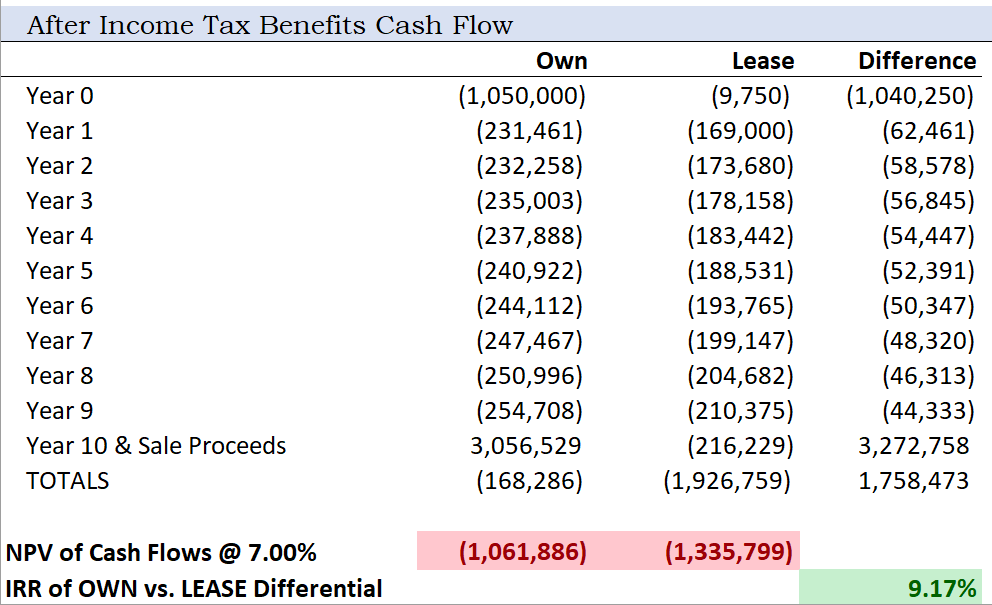
Based on the parameters in this example, it is better to purchase the property because the NPV of the cash flows is greater (or less negative). In addition, the IRR of the differential is 9.17%, which is greater than the 7% discount rate.
Final Thoughts
When considering leasing or ownership of real estate assets, it is necessary to model the estimated cash flows for the entirety of the holding period and to calculate the valuation of them in the present time. Whichever set of cash flows is greater is the one that makes the most sense from a purely financial standpoint.
However, not all decisions are made from a purely financial perspective. Other considerations in this decision include a company’s need for capital, their desired flexibility, their appetite for managing their own assets, and whether or not the property has the proper zoning for its intended use.