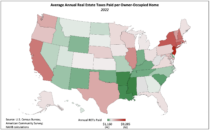
NAHB analysis of the 2022 American Community Survey data shows that New Jersey leads the nation with the highest average annual real estate tax (RET) bill ($9,285)—$8,425 more than yearly property taxes paid by Alabama’s homeowners ($860). The size of this disparity grew 1.1% in 2022 and has increased 9.3% since 2017. Vermont was the only state for which the average real estate tax bill declined over the year.
The map below illustrates the concentration of high average property tax bills in the Northeast and on the West Coast. In contrast, home owners in Southern states (excluding Texas) pay some of the lowest RET bills in the country.

As property values vary widely by state, controlling for this variable produces a more instructive state-by-state comparison. In keeping with prior analyses, NAHB calculates this by dividing aggregate real estate taxes paid by the aggregate value of owner-occupied housing units within a state. The effective tax rate can be expressed either as a percentage of home value or as a dollar amount levied per $1,000 of this value.
New Jersey also has the distinction of imposing the highest effective property tax rate—1.85% or $18.52 per $1,000 of home value–although Illinois followed closely behind at 1.84%. In contrast, Hawaii boasted the lowest average rate in the nation (0.27%) equal to $2.68 per $1,000 of value. However, this low rate combined with extremely high home values results in middle-of-the-pack per-homeowner property tax bills. Hawaii’s average owner-occupied home value ($948,025) the highest in the country, with California a close second. They are also the only state’s with an average home value greater than $700,000 (Washington ranks third with an average of $684,427).

The composition of the 10 states with the highest RET bills and property tax rates has remained roughly unchanged since 2017, although Wisconsin fell from having the 6th-highest rate in 2021 to the 10th-highest in 2022.
Interstate differences among home values explain some, but not all, of the variance in real estate tax bills across the country. Texas is an illustrative example of a state in which home values explain little with regards to real estate tax bills faced by homeowners. While Texas ranks in the bottom half of states in terms of average home values, it is 11th in average real estate taxes paid and imposes the 7th-highest average property tax rate.
Of course, neither home values nor a state’s reliance on property tax revenue is fully responsible for the geographic variance of property tax rates and revenues. State spending per resident, the nature of this government spending, the prevalence of homeownership within a state, and demographics all affect tax policy and, thus, the type and magnitude of tax collections. These variables combine to explain the variance that the two factors discussed here do not fully capture.
Discover more from Eye On Housing
Subscribe to get the latest posts to your email.
Varied property tax rates across states can influence construction projects’ financial planning. Lenders might adjust loan terms based on the tax burdens in specific states, emphasizing the importance of understanding regional property tax disparities in construction financing. For construction financing needs, Builderloans.net may help you with it.