Real estate taxes vary widely across states both in terms of annual taxes paid as well as effective tax rates. In 2021, the difference between average real estate taxes (RETs) paid by New Jersey and Alabama home owners was $8,336. New Jersey continued its perennial distinction as having the highest average real estate tax bill per home owner ($9,151) as well as the highest effective tax rate (2.02%).
Hawaii (0.28%) and Alabama ($815) were at the other end of the spectrum, boasting the lowest average effective tax rate and annual real estate tax bill, respectively. The difference between the highest-taxed state (New Jersey) and lowest (Alabama) grew by $362 between 2019 and 2021, more than double the growth between 2017 and 2019 ($170).
The overall distribution has remained roughly unchanged since 2019, as the composition of the top ten remained the same except Washington replaced Texas as the state with the 10th-highest average real estate tax bills. The map below illustrates the concentration of high average property tax bills in the Northeast. In contrast, southern states (excluding Texas) boast some of the lowest real estate tax bills for their resident homeowners.

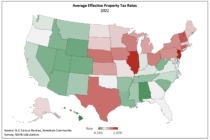
As property values vary widely by state, controlling for this variable produces a more instructive state-by-state comparison. In keeping with prior analyses, NAHB calculates this by dividing aggregate real estate taxes paid by the aggregate value of owner-occupied housing units within a state. The effective tax rate can be expressed either as a percentage of home value or as a dollar amount levied per $1,000 of this value.
The map below shows that New Jersey has the dubious distinction of imposing the highest effective property tax rate—2.02% or $20.22 per $1,000 of home value. Hawaii levies the lowest effective rate in the nation—0.28%, or $2.82 per $1,000 of value. However, this low rate combined with extremely high home values results in middle-of-the-pack per-homeowner property tax bills. Hawaii’s average owner-occupied home value ($822,187) is second only to California’s ($831,859) and is 61% higher than New York’s ($509,768).

Interstate differences among home values explain some, but not all, of the variance in real estate tax bills across the country. Texas is an illustrative example of a state in which home values hardly, if at all, explain real estate tax bills faced by homeowners. While Texas ranks in the bottom half of states in terms of average home values, it is 11th in average real estate taxes paid. Other factors are clearly at play, and state and local government financing turns out to be a major one.
Property taxes accounted for 36.2% of state and local tax receipts in 2021 after making up 39.9% of the total in 2020 due to a broad decline in income tax revenue as a result of the pandemic. However, some state and local governments rely more heavily on property taxes as a source of revenue than others. Texas serves as an excellent example once again.
Unlike most states, Texas does not impose a state income tax on its residents. Even though per capita government spending is tame compared with other states—14th-lowest in the country—Texas and its localities must still find a way to fund spending. Local governments accomplish this by levying the sixth-highest average effective property tax rate (1.50%) in the country. The state government partly makes up for foregone individual income tax revenue by imposing its corporate tax on revenue rather than income.
Of course, neither home values nor a state’s reliance on property tax revenue is fully responsible for the geographic variance of property tax rates and revenues. State spending per resident, the nature of this government spending, the prevalence of homeownership within a state, and demographics all affect tax policy and, thus, the type and magnitude of tax collections. These variables combine to explain the variance that the two factors discussed here do not fully capture.
Discover more from Eye On Housing
Subscribe to get the latest posts to your email.