
Last week we saw a noticeable decline in new listings and active inventory was barely positive. Does this mean housing inventory has begun its seasonal decline? Here are the weekly numbers:
- Weekly active listings rose by only 343
- Mortgage rates rose from 7.08% to end the week at 7.22%
- Purchase apps fell 2% week to week
Weekly housing inventory
At first glance, it seems we’re now seeing the seasonal active inventory decline since new listings data fell noticeably and active listings slowed to where we almost had a decrease in active listing growth. However, one week doesn’t make a trend. Yes, we are at the period of the year where we traditionally see a seasonal decline, but we need more confirmation.
Last year, we saw an active listing decline in the same week but then listing growth continued until Oct. 28. However, in 2022, home sales were collapsing in the fastest fashion ever in history, so we must be mindful of comparing this year to last. That said, I hope we extend inventory growth longer before the seasonal decline. Here are the numbers, according to Altos Research:
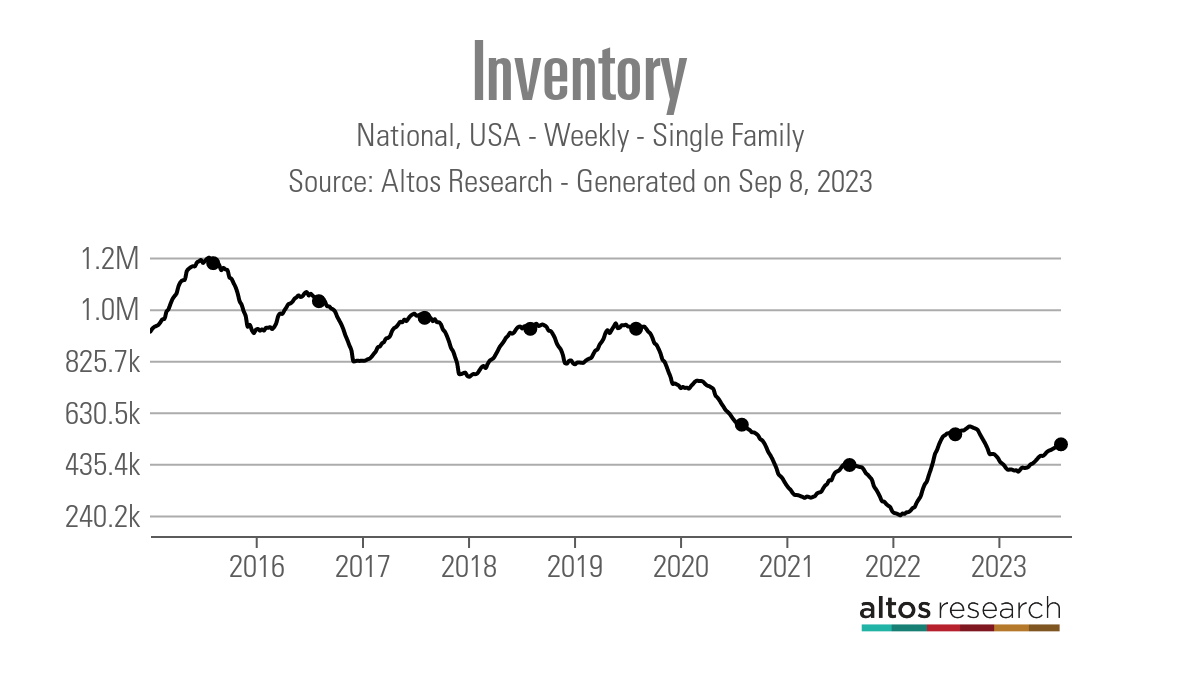
- Weekly inventory change (Sept. 1-Sept. 8): Inventory rose from 508,813 to 509,156
- Same week last year (Sept. 2-Sept. 9): Inventory fell from 552,536 to 547,222
- The inventory bottom for 2022 was 240,194
- The inventory peak for 2023 so far is 509,156
- For context, active listings for this week in 2015 were 1,195,099
Inventory growth has been slow this year, especially compared to last year. This is why I tell people to be cautious in reading too much into the negative year-over-year inventory since June 2022 will always be tied to the most significant one-year sales crash in U.S. history.
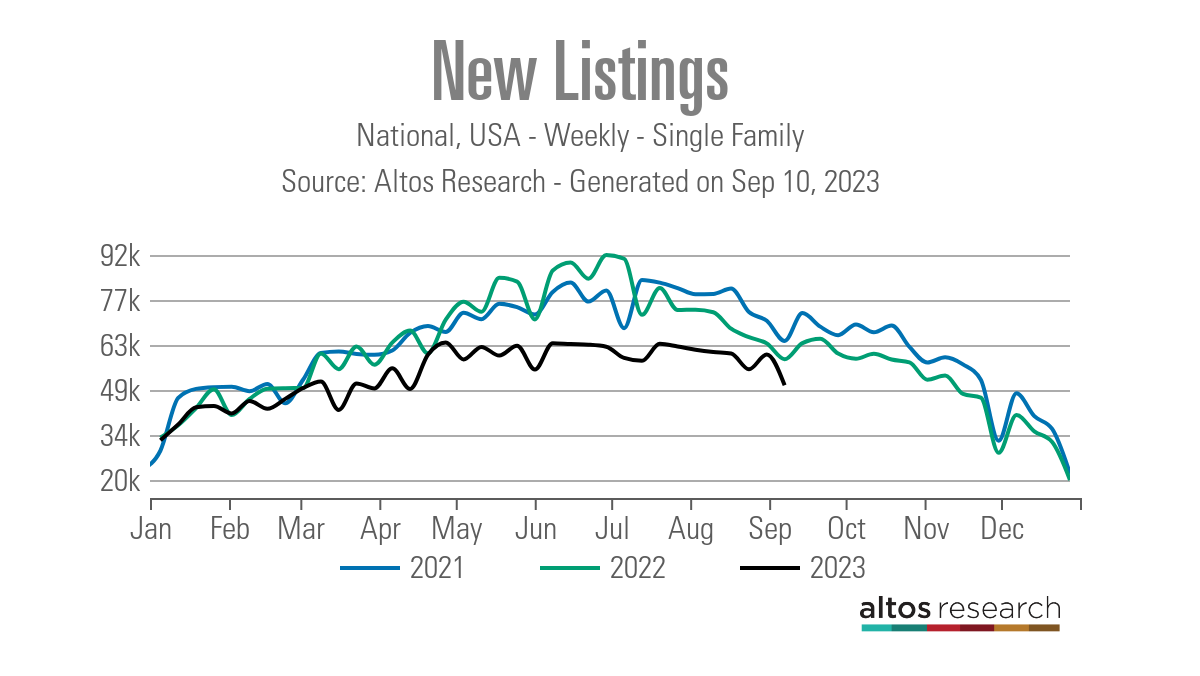
New listing data is getting interesting: two weeks ago, we had a noticeable decline from the trend and then a weekly rebound. I chalked it up to Labor Day holiday timing, but last week, we had a more noticeable move lower week to week. I am hoping we regain the previous trend next week. Here’s the new listings data since July 21:

- July 21: 63,375
- July 28: 62,525
- August 4: 61,490
- August 11: 60,759
- August 18: 60,295
- August 25: 55,291
- September 1: 60,004
- September 8: 50,212
We had an orderly, slow seasonal decline for some time, but the last three weeks have been bumpy.
Mortgage rates and the bond market
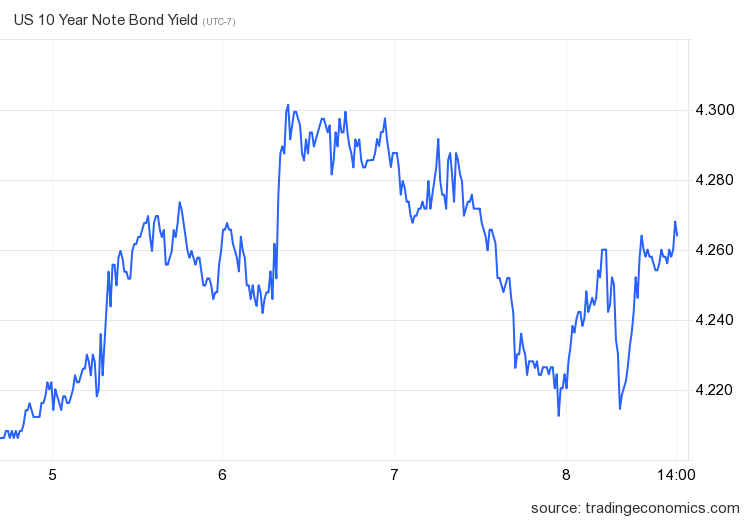
Last week, mortgage rates caught up with the rise in bond yields and rose as high as 7.33% before ending the week at 7.22%. The one critical level for me since we broke above my peak 4.25% 10-year yield call is whether the 10-year yield can break over 4.34%, which was the intraday high of last year.
So far, three attempts to break that level haven’t panned out, but I am focusing on it because a break above that level could send mortgage rates to a brand-new high for 2023.
Purchase application data
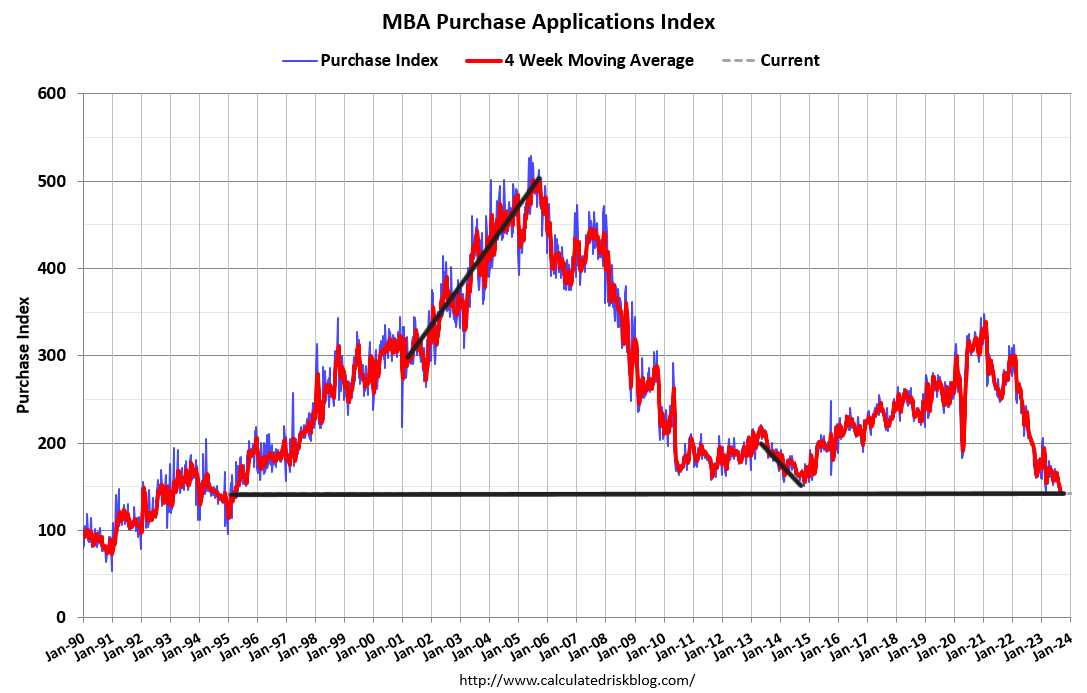
Purchase application data was down 2% weekly, making the year-to-date count at 15 positive, 18 negative prints and one flat week. If we start from Nov. 9, 2022, it’s been 22 positive prints versus 18 negative prints and one flat week.
Higher rates have slowed demand and sent purchase apps back to 1995 levels. But, the bar is shallow here, with the data line back to 1995 levels and we have to remember that purchase apps are very seasonal since total volumes always fall after May. Last year, when mortgage rates fell, we saw demand pick up a bit, but context is key; we are working from deficient levels today.
The week ahead: Inflation week again
We are at that part of the month where we will get the two inflation reports, CPI and PPI data, to give us a sense of where inflation is running. Headline inflation has increased recently with oil prices rising, but core inflation has more downside. The Federal Reserve is more concerned about core inflation data, which should be the key in this week’s CPI report.
Retail sales and jobless claims will also come out this week, so we have some key economic reports that can move the bond market. And of course that could also move mortgage rates since these two have been in a lovely slow dance since 1971.


Great article thank you.