Did the recent move in higher mortgage rates impact the new listings data more than normal? I hope this isn’t the case, but we had a noticeable move lower in new listings last week. The Fed spoke at Jackson Hole last Friday but that didn’t move mortgage rates much. Also, purchase applications data took another week-to-week dive.
- Weekly active listings rose by only 6,618.
- Mortgage rates went from 7.37% to 7.48% and back down to 7.37%
- Purchase apps fell 5% week to week.
Weekly housing inventory
Let’s focus on the big move lower in new listings, which I hope was just a one-off and not related to higher mortgage rates. I have been pleased with the orderly decline in new listings in the last two months, but this week saw a big move lower. As mortgage rates rose to 23-year highs and new listings data fell, I saw a possible corollary between the two. I don’t usually put any weight in one week’s data, but since rates just broke to new highs, I was mindful of this possibility. As shown below, this data line had a slow, orderly decline during the seasonal period but picked up speed last week. I am hoping this changes course for the upcoming week.
- July 21: 63,375 new listings
- July 28: 62,525
- August 4: 61,490
- August 11: 60,759
- August 18: 60,295
- August 25: 55,291

Total active listings grew slightly more than last week, but it is still too slow for my taste. However, seasonality is about to kick in here. I would like to extend seasonality a bit longer to have more active inventory in the system before winter.
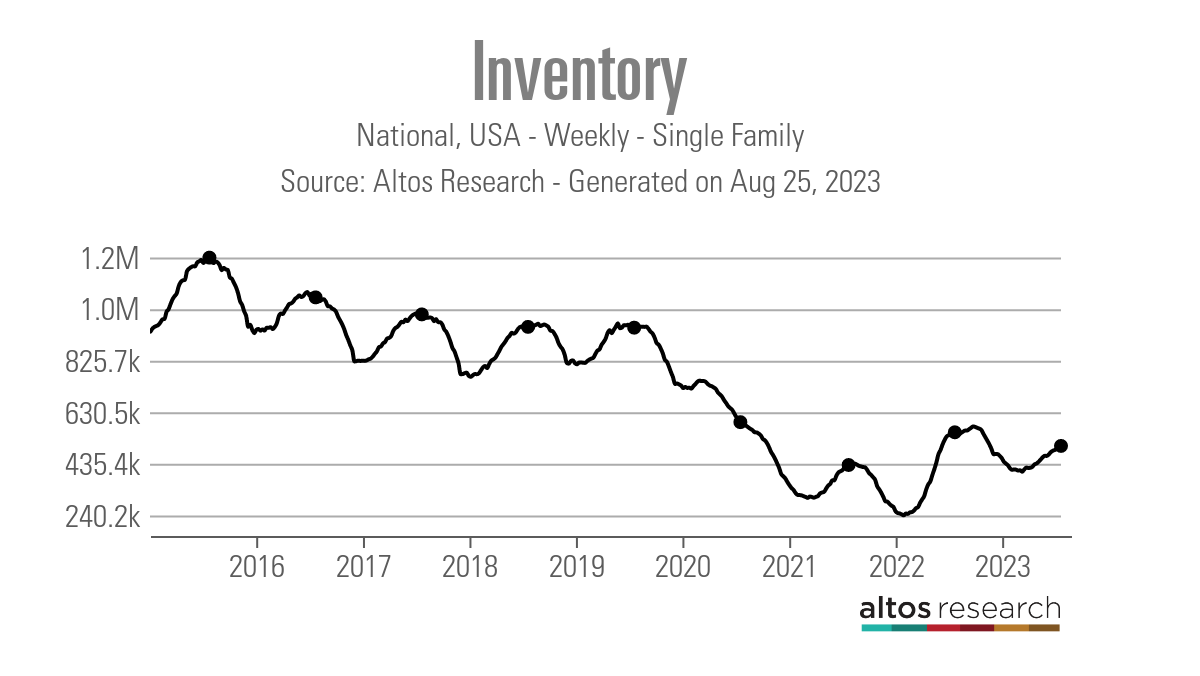
Weekly inventory change (August 18 — August 25): Inventory rose from 496,541 to 503,159
- Same week last year (August 19 — August 26): Inventory rose from 551,458 to 554,748
- The inventory bottom for 2022 was 240,194
- The inventory peak for 2023 so far is 503,159
- For context, active listings for this week in 2015 were 1,216,061
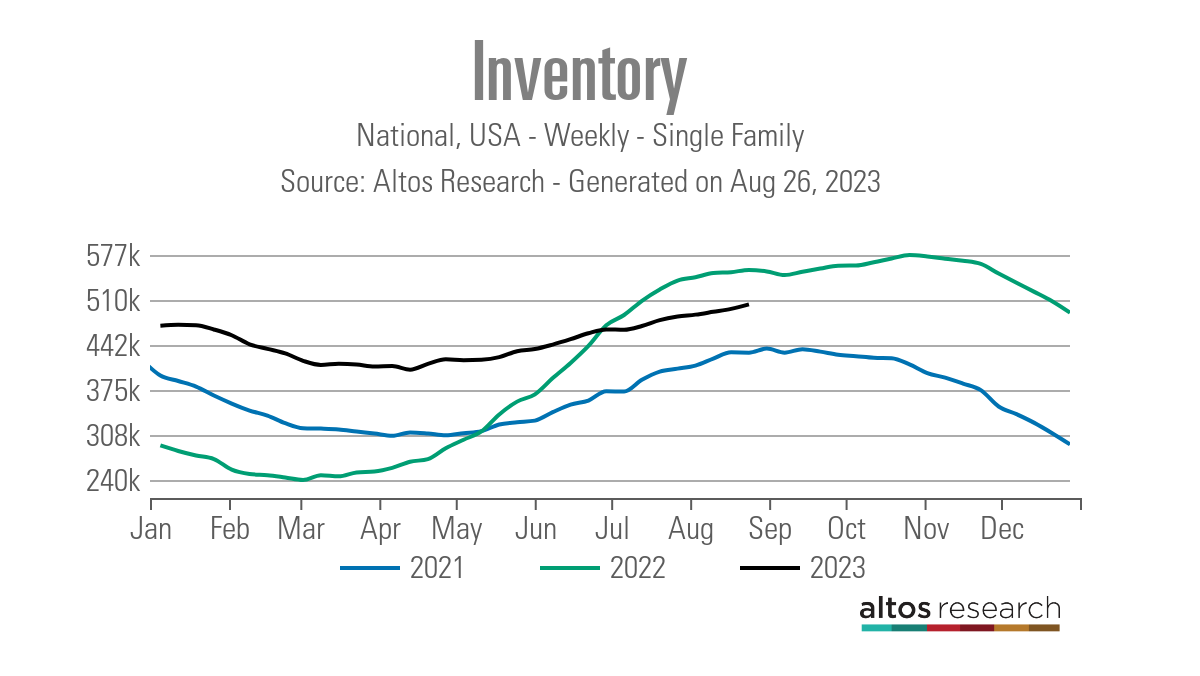
As we can see in the chart below, we have been showing negative year-over-year inventory since June. Last year’s move-in inventory looked like a rocket compared to the slow-moving zombie of 2023.
Mortgage rates and bond yields
This was a key week for the 10-year yield and mortgage rates. I talked about how critical it was for us not to close above 4.34% and see the bond market selling off more after that. That had the potential to send mortgage rates to 8%. However, this last week, we held the line and closed below my peak 4.25% forecast level on the 10-year yield.
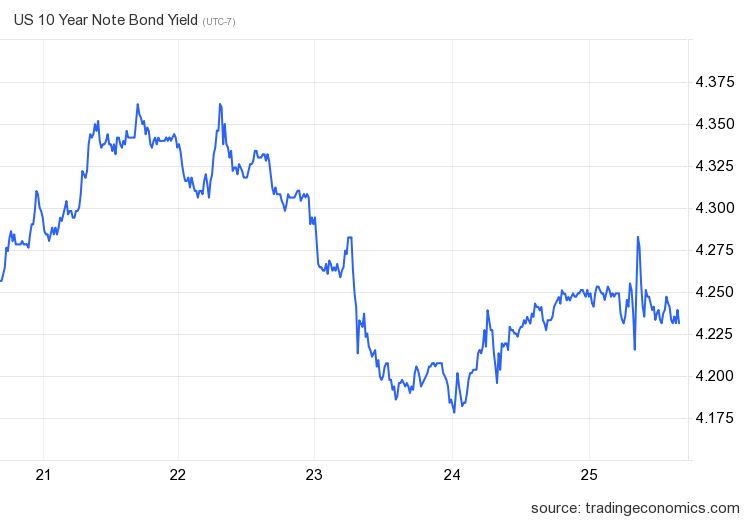
For this week and the rest of the year, I am only focused on seeing if the 10-year yield can close above 4.34%. The farther we stay away from that level; the better. As we can see in the chart below, the lower inflation growth rate has not helped mortgage rates this year, as the economy is still holding up.
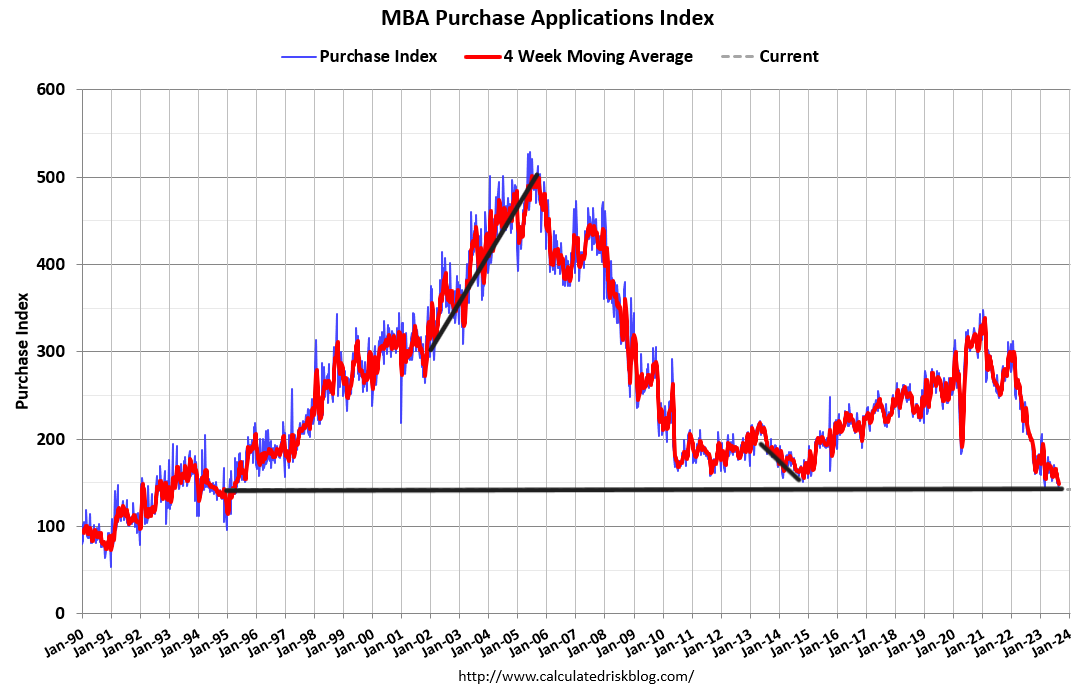
Purchase application data
Purchase application data was down 5% weekly, making the count year to date at 14 positive and 17 negative prints and one flat week. If we start from Nov. 9, 2022, it’s been 21 positive prints versus 17 negative prints and one flat week. While home sales aren’t collapsing like last year, the forward-looking housing data is getting weaker and weaker because we haven’t had growth data with rates above 7%. Historically, we are at extreme lows, so it wouldn’t take much to move the needle positively, but we need to see lower rates.
The week ahead: Jobs week, inflation data, pending home sales, home prices
It’s jobs week again, so look for the big four reports — job openings, ADP, jobless claims, and the Friday Bureau of Labor Statistics jobs report. The key for the Fed is that they want less job growth, slower wage growth, fewer job openings, and higher unemployment claims. We will also get the national home price data updated.
Don’t miss the Housing Bubble Crash debate on August 31. Register here.
The Fed’s main inflation report, the Personal Consumption Expenditure report, is out this week. This is where they want to see progress toward 2%. We also have pending home sales, and as the purchase application data has shown for many weeks, home sales are slowing down. Buckle up, everyone; it will be a wild ride with economic data.