

How’s the market, you ask? The typical seasonal spring in its step has been replaced by a slow shuffle as the Seattle/King County residential market tries to find its rhythm in a challenging economic environment.
Falling new inventory is constraining transaction volumes while also supporting higher home prices. It’s a dynamic not often seen in our area and it – along with stubbornly high mortgage interest rates – has generated a rollercoaster ride of data that would make Six Flags jealous.
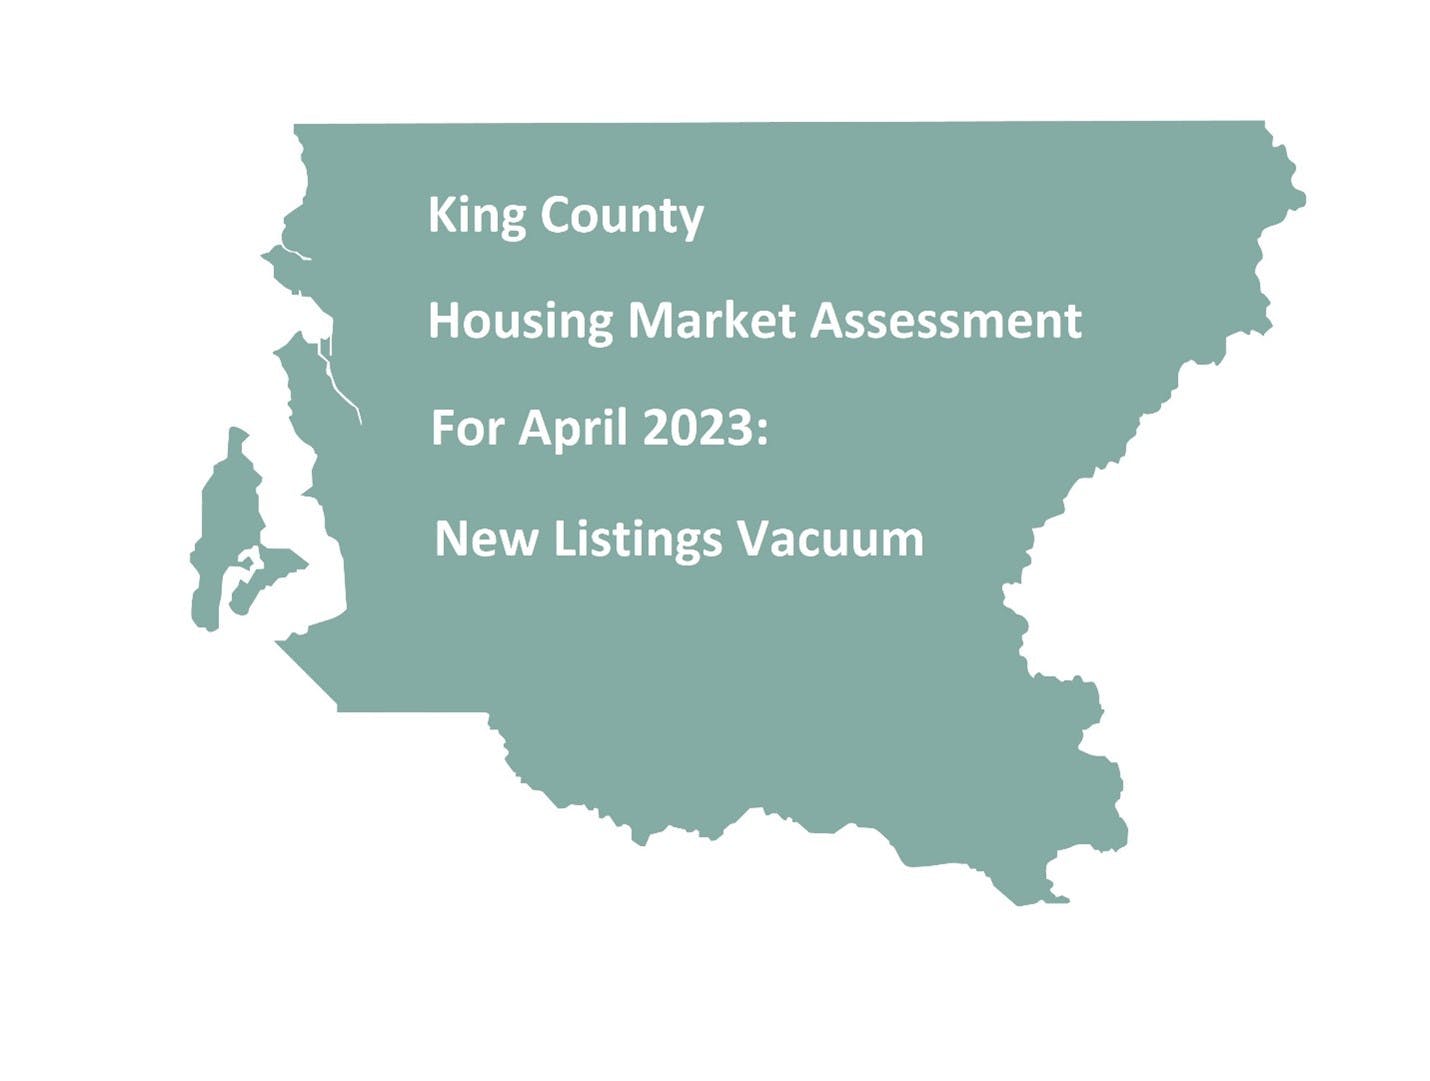
The number of new April listings for all home types in King County (2638) was 10% lower than the previous month, at a time of year when spring real estate activity should be taking off. The chart (below) puts it in sharp focus: Except for the pandemic year of 2020 when there were 2559 new listings that April, last month was the slowest April since at least 2008 when easy access to Northwest Multiple Listing Service data became available. April’s figure was 37% lower than a year ago and, for context, the five-year April average of new listings just before the pandemic began was 4021.
The Eastside market – comprised of Kirkland, Bellevue, Factoria and eastward – led the slide with a 22% month-to-month drop-off, on 726 new listings, 45% fewer from April 2022. Seattle had a 6.6% (1045) new-listings decline from the previous month and was down 28% year-on-year (YoY).
Where are all the sellers? They’re sitting comfortably at home enjoying mortgages with historically low interest rates and little incentive to move. A full 82% of sellers and buyers felt “locked in” by their current (low) mortgage rates, according to a survey released by realtor.com. You can’t buy what’s not for sale!
The inventory may not be there, but the demand sure is. Pending sales – those listings that went under contract in April – rose 3.0% (2435) from March in King County. Seattle’s mutually agreed sales rose 6.4% (884) month-to-month while the Eastside added 2.5% (702). Pending sales were down 27% YoY countywide, however.
Sales volumes were mixed in April – up 1.9% (704) month-to-month in Seattle, flat (540) on the Eastside and down 4.1% (1876) across the county. Sales on an annual basis were 39% lower in King, including down 40% on the Eastside and off 34% in Seattle.

The numbers are similar for the single-family-home category, with new listings in King down 11% (2021) for the month and Active listings up 3.1% (1842). Eastside new listings fell off the charts, down 21% (554) in the past month and off an incredible 48% from a year ago. Pending sales were up 1.6% (1866) for the month in King but down 28% YoY, while sales volumes were down 3.9% (1456) month-to-month and 38% lower YoY.
Housing affordability continues to haunt prospective buyers – particularly first-timers – who are also watching their job security (especially in the tech sector) and personal finances to help determine when, or even if, a new home is in their future. Hindering their chances are now-rising home prices amid limited inventory.
The median price on all home types (condos, townhomes and single-family houses) in King rose 4.0% from March to April to $790,244 and up 9.3% since the start of this year. Prices are down 10% YoY, however. Seattle median prices added 2.8% ($790,000) for the month and 11% YoY, and prices in North King County (Shoreline, Lake Forest Park) soared 11% ($852,000) since March. After witnessing prices soar 17% from February to March, the Eastside bucked the general trend in April, down 1.9% ($1.2M) for the month and off 21% YoY.
Single-family prices are experiencing the same painful gains for consumers. They are up 4.2% ($875,000) from March across the county but down 12% from this time last year. Seattle single-family prices are up 1.8% ($886,000) for the month and off 13% YoY, while Eastside prices added 2.7% ($1.45M) since March and down 16% YoY, according to the Northwest MLS.
The Case-Shiller housing index tracks home prices in 20 key markets, including Seattle metro, where the index is 9.0% lower YoY (through February, latest available data). That’s nowhere near the historic drop during the housing crisis when Seattle’s index reading fell 30.1% between May 2007 and January 2012. As the latest MLS data show, prices are now rebounding – even galloping – higher.
Any downturn in the U.S. housing market appears to have hit its nadir. If the pricing low point has passed – it came in January ($723,000) for King – then it would be but a hiccup compared to the average 34% peak-to-trough fall in national home prices experienced in a 4–6 year timespan during the Great Recession.
Homes are selling at 101.4% of the list price in King County today, the highest rate since last June (103.6%), MLS figures show. Seattle homes are selling at 101.9% of list price, and Eastside homes are at 100.5%, a far cry from the 114.1% average one year ago. About 25% of all county listings in the past four weeks included offer/review dates, a set timeframe to submit offers and a way for sellers to potentially inject urgency for buyers to decide whether to submit a bid.
Condo activity remains mostly muted, with 9.1% (617) fewer new listings than a month ago, including 7.7% (301) fewer in Seattle since March. Eastside condos have disappeared from the radar, with a 23% (172) monthly decline in new listings. Pending sales across King are up 7.8% (569) for the month but sales volumes are off 4.8% (420) since March. Median prices jumped 6.0% ($620,000) on the Eastside and were up 1.0% ($539,000) in Seattle but down 1.0% ($502,500) across the county after North King experienced a sharp 28% ($497,500) price drop-off in the past month.
Supply numbers have moved little in the past several weeks. Overall, there are 1.4 months of inventory for all home types in King, up from 1.3 last month. Seattle inventory was unchanged at 1.6 months and the Eastside was down to 1.3 months from 1.4. (All figures are rounded.) The inventory of single-family homes stands at 1.3 months for King, 1.3 for Seattle and 1.4 for the Eastside – little changed from March’s figures. There are 1.7 months of inventory on the King County condo market, including 2.4 months in Seattle and 1.2 on the Eastside. (Inventory spotlights the number of months it would take to exhaust existing inventory if no new listings hit the market.)
In addition to King County’s 4.0% median price month-to-month increase on all home types, to $790,244, Snohomish County saw the second-sharpest jump – a 3.5% rise from March to April ($703,827). Prices in Pierce ($515,000) and Kitsap ($510,000) were statistically unchanged for the month. Single-family home prices in King added 4.2% in a month ($875,000), but the strongest gain went to Snohomish, up 6.0% from March ($767,500) amid only 1.0 month of inventory – the slimmest supply in our region. Single-family prices in both Pierce ($525,000) and Kitsap ($520,000) were flat since March. Year-to-year, single-family median prices all remain lower, led by a 12% drop in King, followed by a 9.5% decline in Pierce, 8.6% lower in Snohomish and down 8.0% in Kitsap. It’s also worth noting condo prices in Snohomish soared 10% ($544,900) from March to April amid a scant 0.6 months’ inventory.
To be sure, comparing the latest MLS data with a year ago is not helpful. Economic conditions have gone through an entire wash-spin cycle (consumers’ heads may be spinning too!), accented by surging interest rates and inflation followed by a rapid housing cool-down. Month-to-month and year-to-date comparisons are better measures today.
Potential buyers will no doubt know that mortgage rates remain high at around 6.5% (depending on a mortgage applicant’s situation) as the Federal Reserve continues to raise short-term rates for banks to borrow funds. The 10th such rate increase in early May applies more pressure on financial institutions to follow suit on everything from car loans to mortgages. The U.S. central bank has lifted its Fed funds rate by an unprecedented 5.0 percentage points in the last 14 months.
The Fed is attempting to apply pressure on corporate America to slow down manufacturing and hiring while also hoping consumers will ease their spending habits that contribute to the increase in production. The key economic indicator – inflation – is at 5% on an annual basis, a steady improvement from the peak 9.1% rate last June and even the 6.5% level at Christmas. Inflation hasn’t been this low since May 2021.
The Fed is aiming for a 2.0% inflation rate, a level not seen since March 2021, and economists believe we are at least six months away from seeing it again. Inflation is trending in a reassuring direction (I am even buying eggs again!) and the central bank should now halt its regular rate increases.
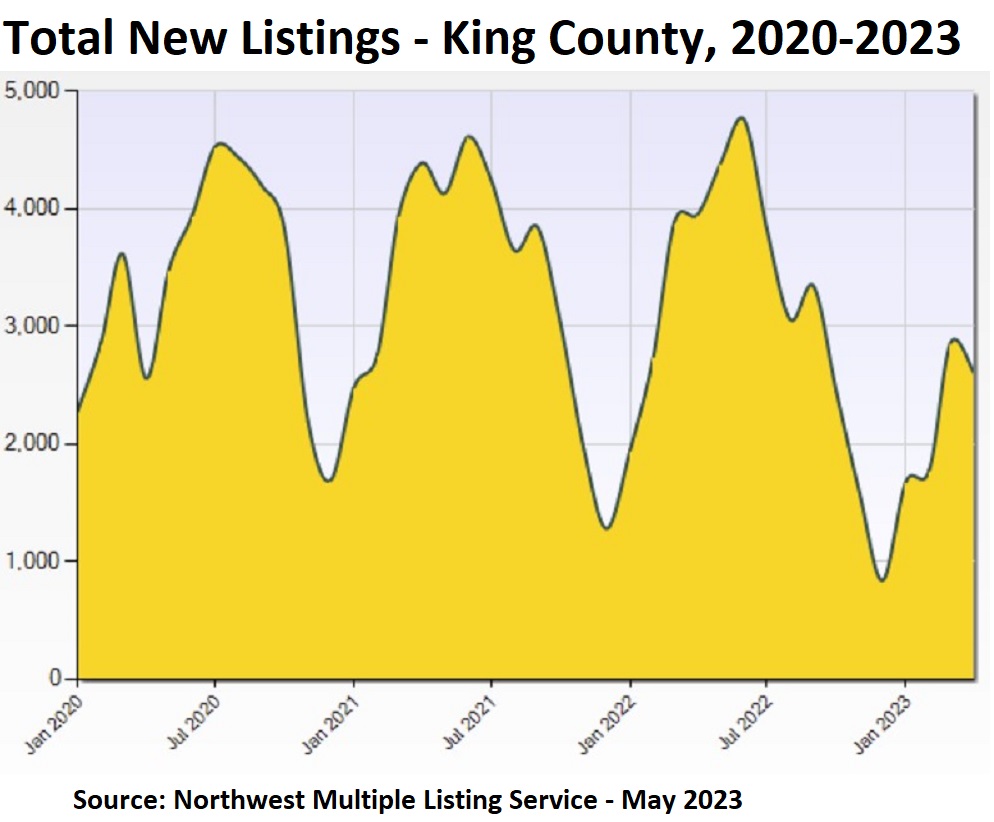
The chart (below) shows that, in hindsight, the Fed acted too slowly when it held short-term rates at an effective 0% level before quickly ratcheting interest to where it is today – coincidently at the same 5% figure as the inflation rate, measured by the Consumer Price Index (CPI).
“We’ve had a tremendous decline in inflation year-over-year,” notes leading economist Dr. Marci Rossell. “It if continues along this trajectory by the end of the year, inflation will be running between 2% and 3%. [Then] the Federal Reserve will be free to bring [interest] rates down to what’s an appropriate rate for an economy that’s growing 2% and inflation at 2%.”
Rossell’s prediction for mortgage rates is heartening: “The Federal Reserve is likely to lower rates, which will drag down mortgage rates into an area … that’s really sustainable from an affordability point of view.”
An April survey from U.S. News & World Report found that two-thirds of homebuyers are holding off on house hunting until mortgage rates drop. As for how low they need to go to get buyers moving, 28% said they will resume home shopping once rates drop below 6%; 30% plan to wait until they go below 5.5%. Lower rates will, naturally, spur demand and they will also theoretically “unlock” homeowners to sell.
Before the housing market crash in 2007, the average length of time someone lived in their home was approximately five years. Average tenure grew to approximately eight years during the aftermath of the housing market crisis between 2008 and 2016. Since then, it has increased to a historic high of 10.7 years in March 2023, according to recent data, thanks in part to the rate-lock effect.
Most experts do not believe rates will fall to 5.5% – at least not for another year – so some potential home buyers will likely be sitting on the sidelines for a while longer.