Recently, the director of the Federal Housing Finance Agency (FHFA) issued a statement clarifying the agency’s rationale for changes to loan level pricing adjustment (LLPA) fees going into effect on May 1. The changes have created some controversy due to the fact that better credit quality borrowers will experience higher fees after May 1 than under the current LLPA grids and vice versa for lower credit quality borrowers.
The FHFA stated that the goals of the fee changes were “to maintain support for purchase borrowers limited by income or wealth, ensure a level playing field for large and small lenders, foster capital accumulation at the Enterprises, and achieve commercially viable returns on capital over time.”
Therein lies some of the confusion. The fact is that the FHFA is applying a form of risk-based pricing to the exercise based on their expectations of long-term performance of mortgages going forward. However, the new LLPAs reflect a process that reduces the effects of risk-based pricing based on other objectives, the outcome of which will benefit high-risk borrowers at the expense of low-risk borrowers by flattening the relationship of credit risk to credit score and LTV.
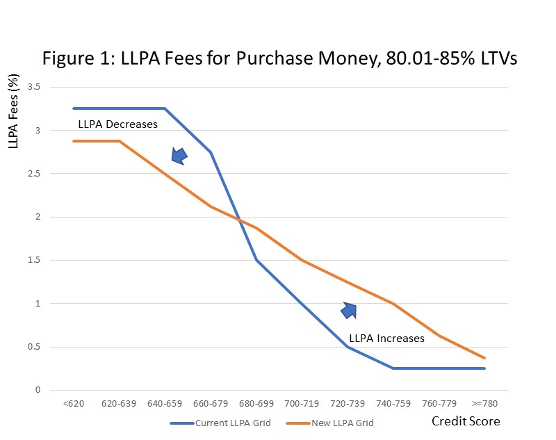
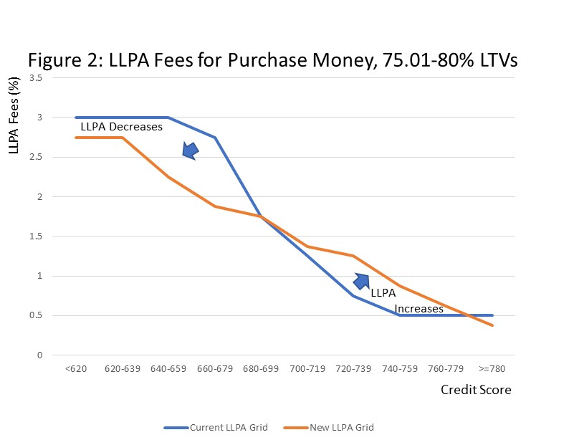
To gain a visual sense of how the fees will change, consider Figures 1 and 2 below that display the actual LLPAs for two critical borrower segments; 75.01-80% LTVs (no mortgage insurance required) and 80.01-85% LTVs (with mortgage insurance) by credit score. In both cases the current and new LLPA grids show what we should expect generally if loans are risk-based priced, i.e., fees increase as credit scores decline.
However, notice that the new LLPA curve is significantly flatter than the current LLPA curve for both LTV groups. A flattening of the curve suggests that there is less differentiation in fees across credit score categories holding LTV constant. In the extreme, without risk-based pricing, the curve would be horizontal across credit scores, i.e., no differentiation in fees.
In other words, the new grids have become less risk-based, and that has implications for high- and low-risk borrowers. By flattening the curves and pivoting around the 680-699 credit score bucket, high-risk borrowers gain, and low-risk borrowers lose from these changes. What lies behind the curve flattening seems to be the FHFA’s view on the long-term performance of mortgages.
The new fees are set such that, given risk-based capital requirements of the GSEs overall, they would ensure the enterprises achieve a target rate of return. Structuring the LLPAs with this approach still provides the FHFA some latitude to set fees across risk attribute combinations that can achieve other objectives such as supporting low-income borrowers.
As the FHFA pointed out, the current grids were developed some time ago and might reflect mortgage performance from a less benign economic environment than today. If so, the current curves would tend to be steeper if this were the case. To understand how this might happen, consider Figure 3 below, which depicts actual net loss rates for mortgages purchased by Fannie Mae for two different sets of vintages; a more severe period represented by origination years 2005-2007, and 2013-2015 representing a much more favorable period of time.
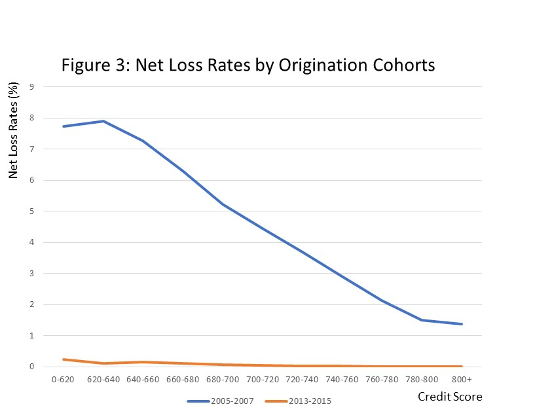
It is clear from Figure 3 that while net loss rates were significantly higher for the 2005-2007 vintages than 2013-2015 originations, the net loss rate curve is flatter for the 2013-2015 cohort. While using these two vintages represents performance extremes, it illustrates that in redesigning LLPA grids to better reflect long-term mortgage performance, the FHFA could be tilting the fee structure more to reflect a flatter relationship of credit performance and risk attributes than before.
Credit performance differences by credit score are more apparent during the more stressful period than during the more favorable economic conditions experienced by the 2013-2015 vintages.
What does this all mean?
First, the FHFA is technically applying principles of risk-based pricing but has clearly dampened the effect based on policy objectives beyond those of ensuring the safety and soundness of the GSEs. The flattening of the LLPA curves suggests that while the FHFA is using a risk-adjusted return on regulatory capital approach to set LLPAs, there was some latitude in setting individual fees that would help support low-income borrowers so long as holistically they met target returns.
Second, the changes will differentially affect borrowers as described above.
Developing the LLPAs in a manner that achieve multiple objectives can be a tricky business with no clear right or wrong answers, but perhaps the FHFA thinks it can have its cake and eat it too by structuring the grids in such a way that it can tout meeting all of its objectives.
But changing grids at a time when there are cracks in the economy might not be in the best interest of the enterprises. While it is technically true that the FHFA is applying risk-based pricing to the new LLPA grids, it has effectively diluted its effect and in the process done so at the benefit of high-risk borrowers to the detriment of high credit quality borrowers and exposes the GSEs to greater risk should a downturn in the economy unfold than if the current LLPAs were left in place.
Clifford Rossi is Professor-of-the Practice and Executive-in-Residence at the Robert H. Smith School of Business at the University of Maryland. He has 23 years of industry experience having held several C-level executive risk management roles at some of the largest financial institutions.
This column does not necessarily reflect the opinion of HousingWire’s editorial department and its owners.
To contact the author of this story:
Clifford Rossi at [email protected]
To contact the editor responsible for this story:
Sarah Wheeler at [email protected]


Figure 3 is fascinating to me, and potentially supports a theory that I’ve been mulling over. The chart illustrates that net loss rates were significantly higher for the 2005-2007 vintages than 2013-2015 originations. This says just as much about that performance of the underlying asset as it does borrower risk.
Could a flattening of the LLPA curve demonstrate that the FHFA is realizing a greater loss correlation to the asset than the borrower? If we are in fact facing a housing shortage and a demographic wave, is the FHFA gaining comfort on asset risk (continued *modest* home price appreciation)?