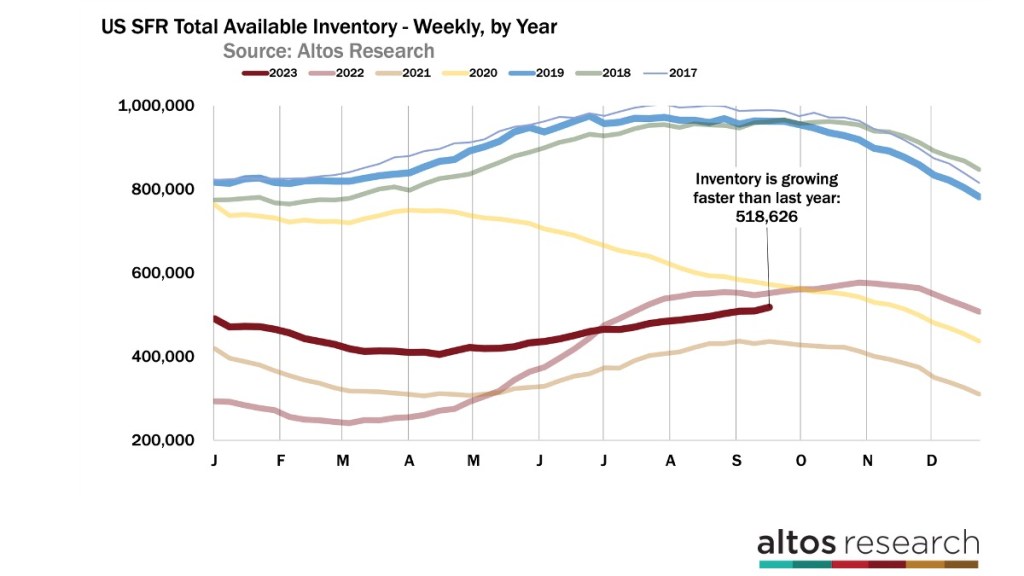
Home sales each week continue to be at depressed levels. We counted only 59,000 new pending sales this week. Meanwhile, the available inventory of unsold homes is growing. This week, inventory grew faster than it did last year at this time. This is alarming because this was the moment last year when the market turned south. This week was the biggest week of inventory increase all year, with inventory growing by over 9,000 single-family homes.
Since inventory is climbing by a notable percentage, we probably have a few more weeks of inventory gains before we hit the top of the curve for the year. It’s not unusual for a little jump in new listings in September. Last year, inventory climbed dramatically for months. This year, inventory is only just starting to increase. This is a trend worth watching.
What’s happening?
Obviously, mortgage rates have been stubbornly over 7% for a couple of months. There was a psychology change for homebuyers in the late summer. That’s a change in expectation of mortgage rates. Buyers early in 2023 had slightly lower rates than now and were optimistic that mortgage rates would go lower still. At the time, most mortgage rate forecasters were assuming the economy would slow so rates would decline. Also, they thought that the spread between the 10-year bond and the 30-year mortgage would narrow, which would mean mortgage rates would end up closer to 5.5% than to 7.5%. The conventional wisdom was that rates would head lower.
We’re hearing people imagine 8% mortgage rates. Early in the year, people were buying at 6.5% and imagining 5.5% where they could refinance. Now, you’re looking at 7.5% and imagining 8% or higher. This “higher for longer” conventional wisdom is working its way through the housing market.
I interviewed Dr. Jessica Lautz from the National Association of Realtors for the Altos podcast and we talked about the prospect of 8% mortgage rates. I checked in with Robert Dietz of the Home Builders Association and they’ve raised their outlook on mortgage rates, as well. This change in buyer expectations is adding to the slowness right now. It’s a pretty abrupt change.
There are now 519,000 single-family homes on the market across the U.S. That’s a 1.9% increase from last week. That’s a big increase this late in the year. This reflects a notable slowdown in demand with mortgage rates well over 7% and this change in expectation of future rates. As I mentioned, the 9,000 unit increase in unsold inventory this week was the single biggest increase week all year. This is an easy way to quantify the decreased demand that goes along with increasing unaffordability.
Context is important. A 9,000-unit increase is the biggest week all year.
Last year, we were seeing inventory grow by 20,000 or 30,000 units per week. Nine thousand is a lot for September but it’s not a lot in the grand scheme. It shows obvious slowing demand, but is also a reflection of the fact that most of the year we had more buyers than sellers of residential real estate. Total available inventory of unsold single-family homes is still 6% less than last year. It’s more than I expected a few weeks ago, but there’s still not a lot of new supply.
The rate of sales each week is discouraging
There’s just nothing in the data that shows sales rates increasing from the very low levels we’ve seen all year. The pace of home sales this year has been both demand and supply-constrained. Right now, it’s a demand story. Most of the year, sales rates have been suppressed for lack of supply — not enough homes to buy. That condition has shifted with the cost of money in late summer.
There were only 59,000 new pending sales of single-family homes in the U.S. this week. That pace of sales remains 10% lower than last year. I was hoping by now the easy year-on-year comparisons would show more sales in Q4 than in Q4 2022 but there’s just no sign of that happening. It’s really now looking at January before the market resets and we see what 2024 has in store for us.
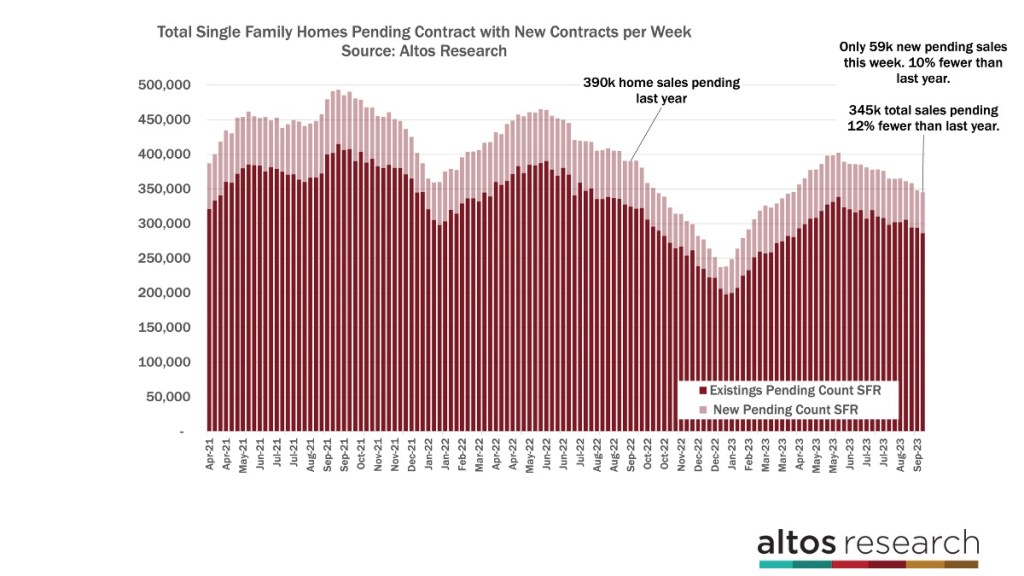
There are 345,000 single-family homes in the contract pending stage. That’s 12% fewer than last year. In this chart the height of each bar is the total count of homes in contract. The light portion of the bar are the new transactions each week. Last year, that new sales rate was plummeting each week. There were still 390,000 single-family homes under contract last year mid-September. I’ve been hoping that our pending sales would finally eclipse last fall, but it isn’t getting there.
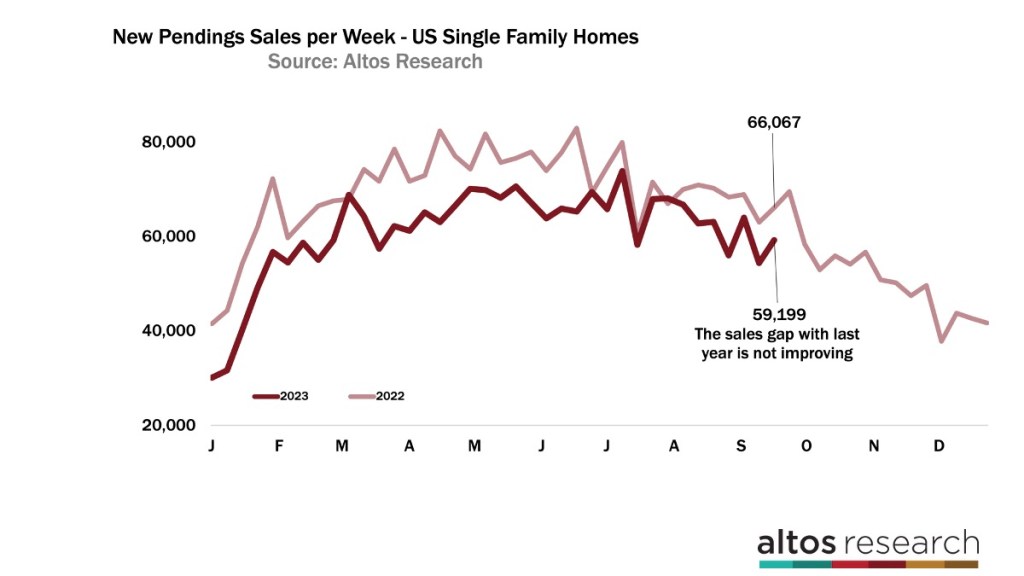
When we look at that new sales rate each week, you can see my disappointment. This is the chart of the new pending sales each week compared with last year at this time. The dark red line is this year. For a while in peak summer it looked like our sales rate would eclipse last year. But then rates surged over 7% and the sales rate responded immediately. Now each week we have 10-12% fewer sales than last year.
You can see in this chart the light red line in October took a big dip last year. That was both seasonal and unusual with a big late year surge in mortgage rates. The only way we end 2023 with more sales than 2022 is if mortgage rates start easing down again and that trend looks durable.
The expectations now are more common that rates aren’t falling, that 8% seems more likely than say 6.5%, and that means a ton to buyers. I always caution that we at Altos do not forecast mortgage rates, and I don’t have quantification of the home buyer sentiment either, this is just speculation on my part based on the information flow I’m starting to see from the people who do forecast mortgage rates. And fact is that we can see significantly fewer buyers in the last couple months. That’s what this chart shows us since July.
Few offers, more price reductions as inventory builds
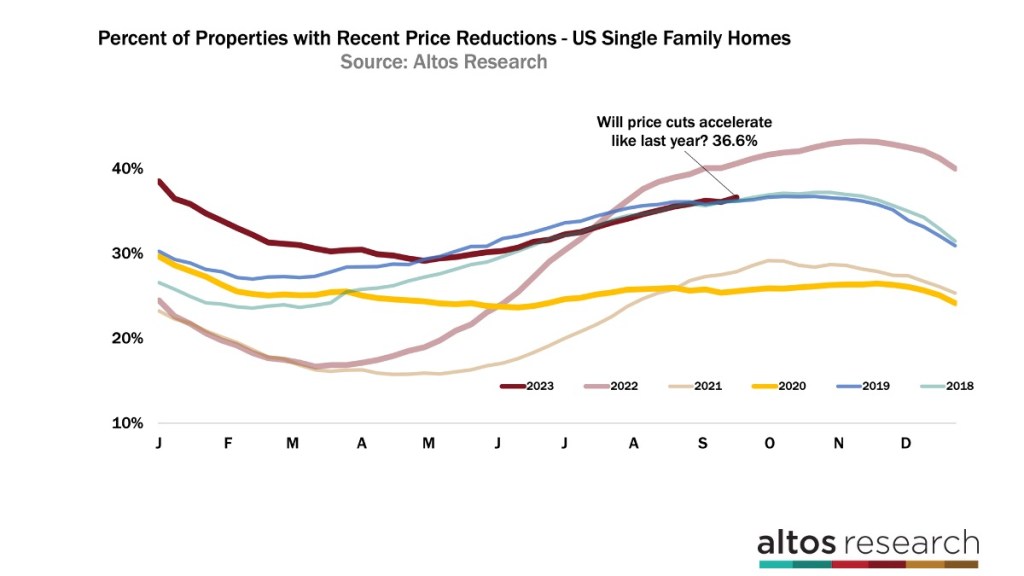
As inventory builds, with fewer offers, so too must the price reductions climb. Sure enough the were more price cuts this week. Up to 36.6% of the homes on the market have taken a price cut recently from their original list price. See the dark red line here, that’s this year’s curve and in the last couple months the trend has reversed from improving conditions for sellers to weakening conditions for sellers. Remember that the price reductions are a leading indicator of where future sales will complete.
There’s a lot of signal in the local markets too. The Texas markets like Austin and San Antonio and even Dallas are the ones where inventory is building and price cuts are climbing.
Home prices still higher than last year
Home prices meanwhile are still on a different seasonal trajectory from last year. The median price of single family homes in the US is $444,900 now. Home prices are still 1% higher than last year. Those comparisons are about to get easier still. The question is whether weakening demand now brings prices lower as quickly as last fall. My suspicion is no. You can see the slope of the dark red line here. Last year home prices peaked higher than this year, and were ratcheting lower, especially in October and November.
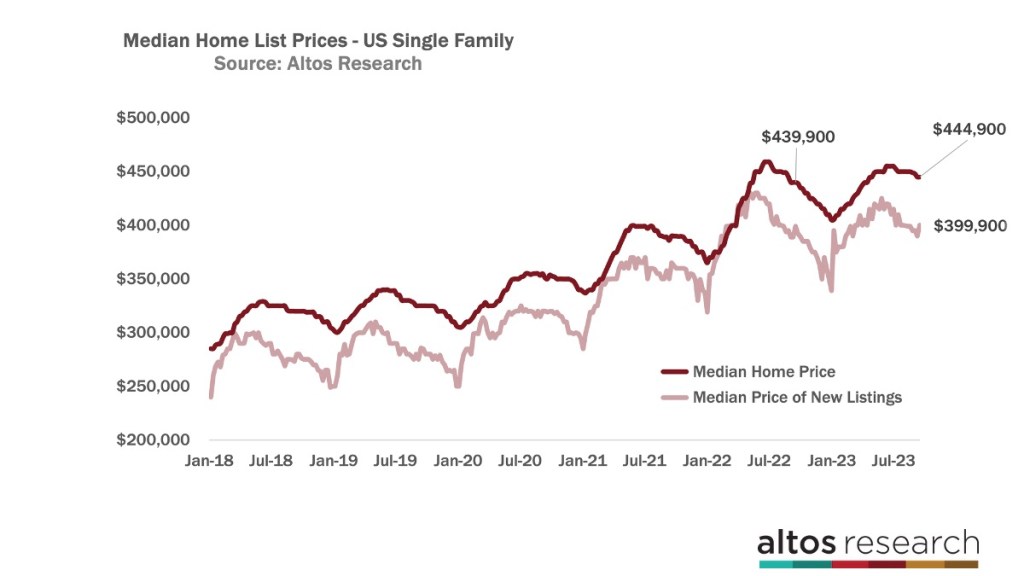
This year the slope of seasonal price declines has been much more gentle. That implies the year over year home price gains will hold or even improve in the 4th quarter. Though I’d point out that home price gains are less important this year than the total transaction volume. The supply and demand constraints. In order for the market to feel more healthy, we need more transactions. The fact that home prices are up year over year just helps us see that there is no 2008 apocalypse happening.
The price of the newly listed properties this week popped up a bit. That’s not unusual for mid-September. So I wouldn’t read too much into it. The price of the new listings is more volatile each week. At $399,900 that’s higher than last year at this time, but can bounce down next week. It’s not plummeting, so again, if you have a hypothesis that the housing market must be crashing, if you assume that home prices are crashing, using the leading indicators like the price of the new listings is helpful to confirm or reject that hypothesis.
Mike Simonsen is president and founder of Altos Research.