The savagely unhealthy housing market continues as existing home sales are near record lows, and the days on the market are still at a teenager level, with home prices rising in 2023. Ladies and gentlemen, this was the fear and now the reality of the savagely unhealthy housing market. We still have too many people chasing too few homes, and while the growth rate of pricing has cooled tremendously, it’s still rising.
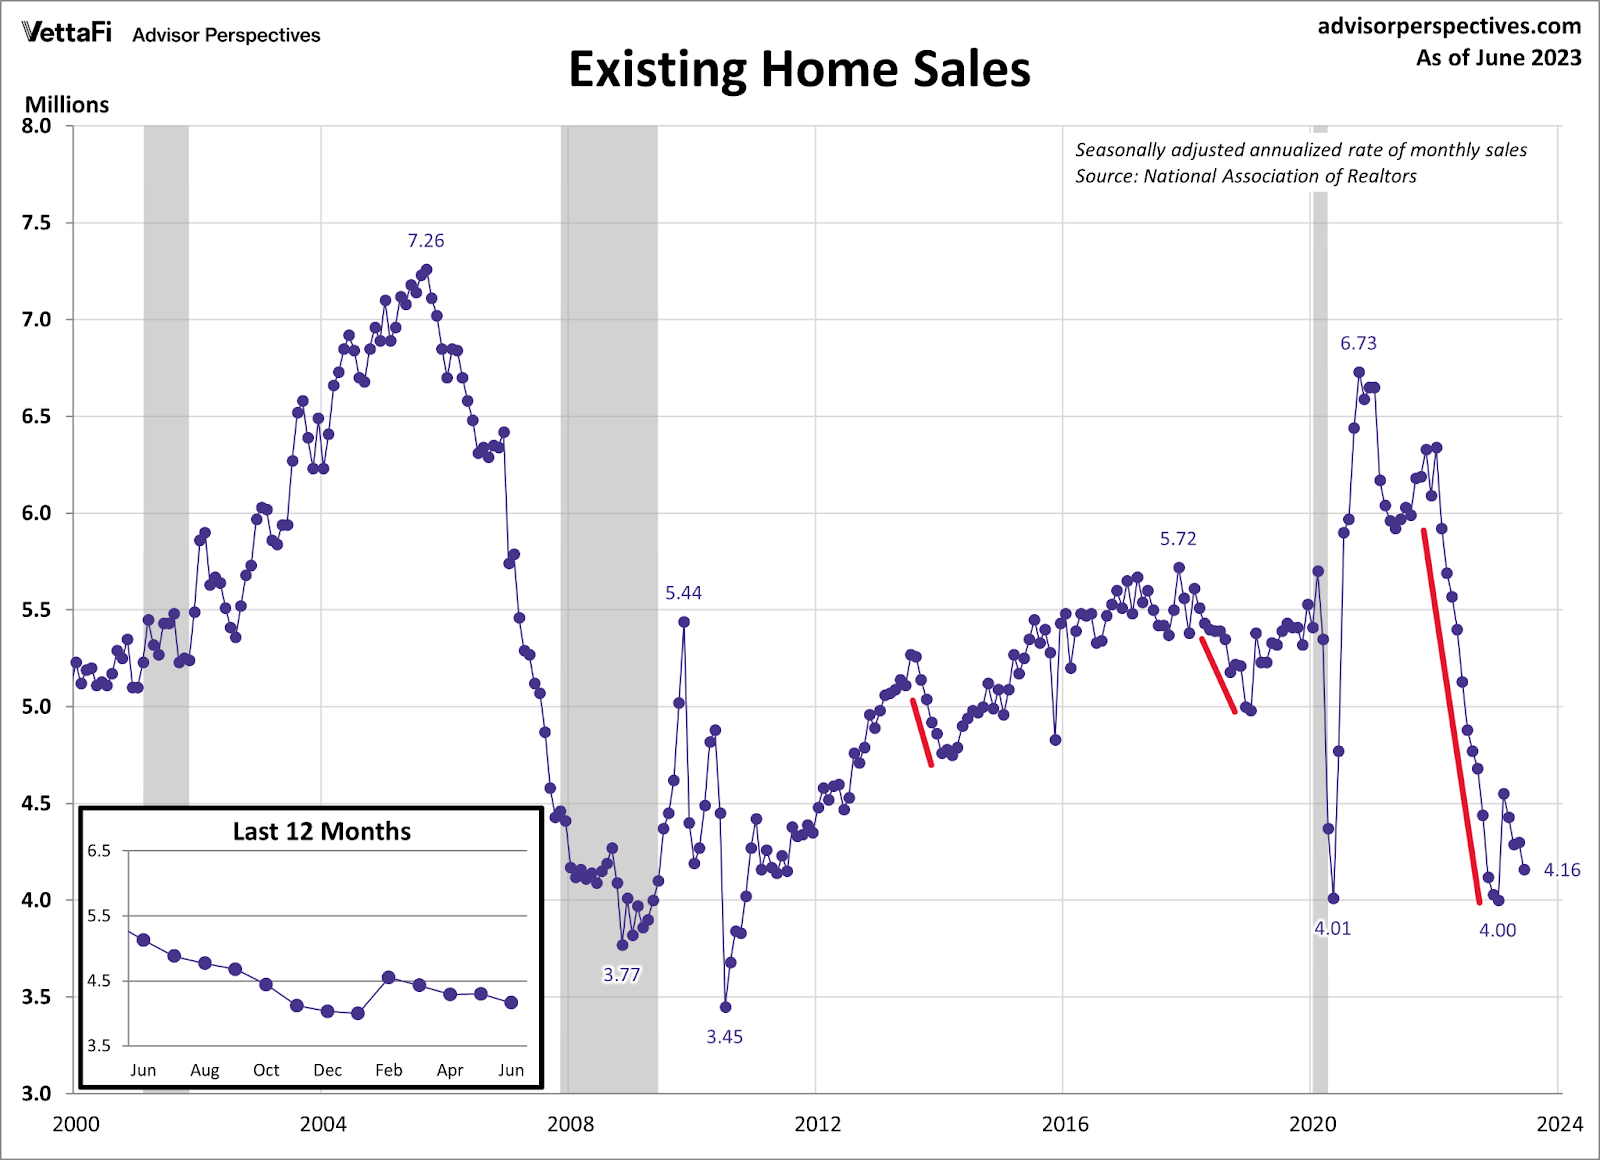
The existing home sales market has stabilized from its waterfall drop in demand but is having difficulty growing sales with 7% mortgage rates. As we can see below, the biggest one-year sales crash in history has ended, but we aren’t increasing after that one giant sales print we had in February of this year.
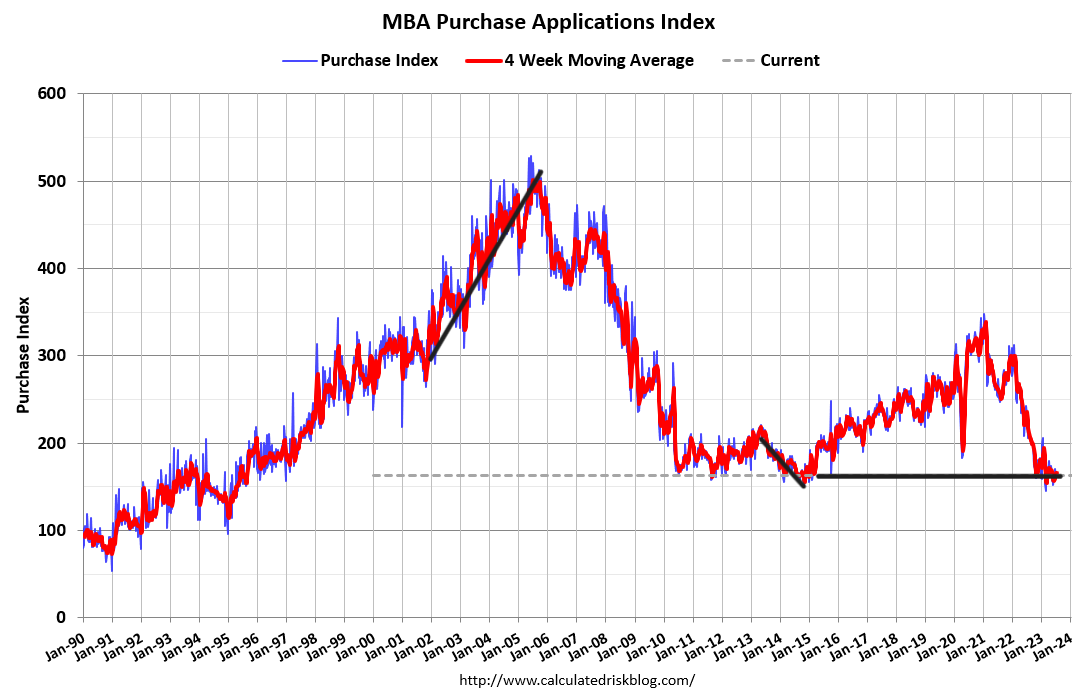
Purchase apps did give us a good sign for a rebound in sales from November to February, which facilitated that big print. However, after the second week of February the data line has been flat for the year.
Year to date, we have 14 positive purchase application data prints versus 13 negative purchase application data prints.
Even with mortgage rates near or above 7% for two months, we haven’t seen dramatic moves in the purchase application data or active and new listings data. The housing market has slowed and stabilized itself with higher rates, but the existing home sales market isn’t growing like the new home sales market. The new home sales market can operate in a sub-6% world while builders buy down rates — the existing home market can’t. Hence, one market is down yearly in sales, and one isn’t.
From NAR: Total existing home sales – completed transactions that include single-family homes, townhomes, condominiums, and co-ops – receded 3.3% from May to a seasonally adjusted annual rate of 4.16 million in June. Year-over-year, sales fell 18.9% (down from 5.13 million in June 2022).
Let’s look at the report and see what we can make of it. First, the one data line I hate to see is that the days on market are back to a teenager level for back-to-back months. You can easily see why home prices took off after 2020 as active listings broke to all-time lows.
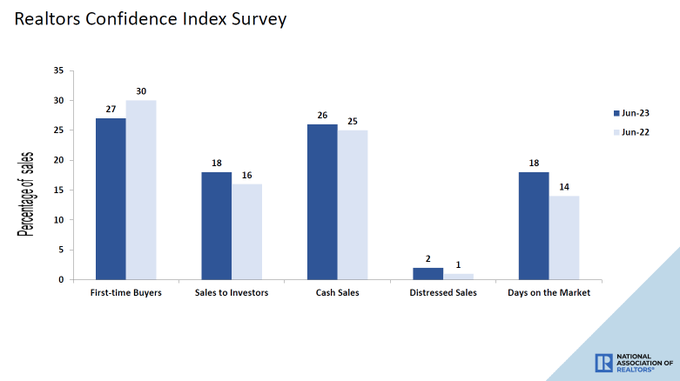
NAR: First-time buyers were responsible for 27% of sales in June; Individual investors purchased 18% of homes; All-cash sales accounted for 26% of transactions; Distressed sales represented 2% of sales; Properties typically remained on the market for 18 days.
This has been a hard concept for me to get people to believe since 2020 because people assumed we were in a housing bubble — even Federal Reserve Chair Jay Powell said we were in a housing bubble! However, if that was the case, when demand collapses, inventory should have skyrocketed, as happens in every housing bubble. Let’s just say the Fed and the housing bubble boys whiffed on that together.
NAR data shows that:
- Traditionally, housing inventory is between 2-2.5 million since 1982
- The peak of the housing bubble years, inventory was 4 million
- Today, inventory is at 1.08 million, down 13.6% year over year from last year’s 1.25 million print with monthly supply at 3.1 months
What levels would make me take off the savagely unhealthy housing market label?

- Inventory between 1.52-1.93 million
- Monthly supply of four months plus
- Days on the market over 30 days
None of that is happening today!
Of course, part of the reason things are so savage is that home prices aren’t collapsing; we have four national home price indices that are already at all-time highs, and even the NAR median sales price index is not far from an all-time high.
NAR: The median existing-home price for all housing types in June was $410,200, the second-highest price of all time and down 0.9% from the record-high of $413,800 in June 2022.

Now we are dealing with 7% mortgage rates, affordability is not getting better and active listings are still near all-time lows with sale levels near record lows. That’s the savagely unhealthy housing market.
Today’s existing home sales report wasn’t shocking in any way, my sale range of 4.0-4.6 million for 2023 is still intact, and I have talked about how I can easily make a case that sales go below 4 million rather than over 4.6 million because we don’t see the growth in purchase application data.
However, with all that said, the housing market stabilizing after the biggest one-year sales crash in history is a testament not only to the credit data of homeowners but the fact that we have demand for housing with rates near 7%. We will still end the year with total home sales near 5 million unless the data worsens over the second half of the year; this is new and existing home sales. This shows the power of mother demographics kicking in.