Starting this week, I will analyze weekly data in a Housing Market Tracker article every Monday to provide a status update on the U.S. housing market and economy. This weekly tracker will give you updates on the data lines that don’t need to wait for monthly housing data reports.
The housing market is one sector that can turn positive or negative very quickly depending on mortgage rates or one-time shocks like we saw with COVID-19. With this weekly update, I’ll give you a heads-up so changes won’t catch you by surprise, and I’ll also point out things to look for during that week.
The three categories I’ll cover will be the weekly purchase application data, the Altos Research weekly inventory data, and what the bond market/ mortgage rates did recently. Unlike sales and price data, which take 30 days to report, this housing market tracker will update data lines released weekly.
Purchase application data
Purchase application data is a forward-looking data line that should account for the sales data 30-90 days away. This has been a vital survey data for me over the past 11 years because the primary resident mortgage buyer is the driver of the U.S. housing market: when this data fades or rises, so does housing.
Last week we continued the positive purchase application data trend that started in November after the first weaker-than-anticipated CPI inflation report. Mortgage rates began to head lower in November, and purchase application data — which shows a waterfall dive in demand — has finally stabilized and bounced off the lows.
The weekly decline in purchase apps was a meager 0.1%. The year-over-year decline came in at 36% but since the peak decline was at 46% year over year, we have bounced off the lows in a noticeable fashion.
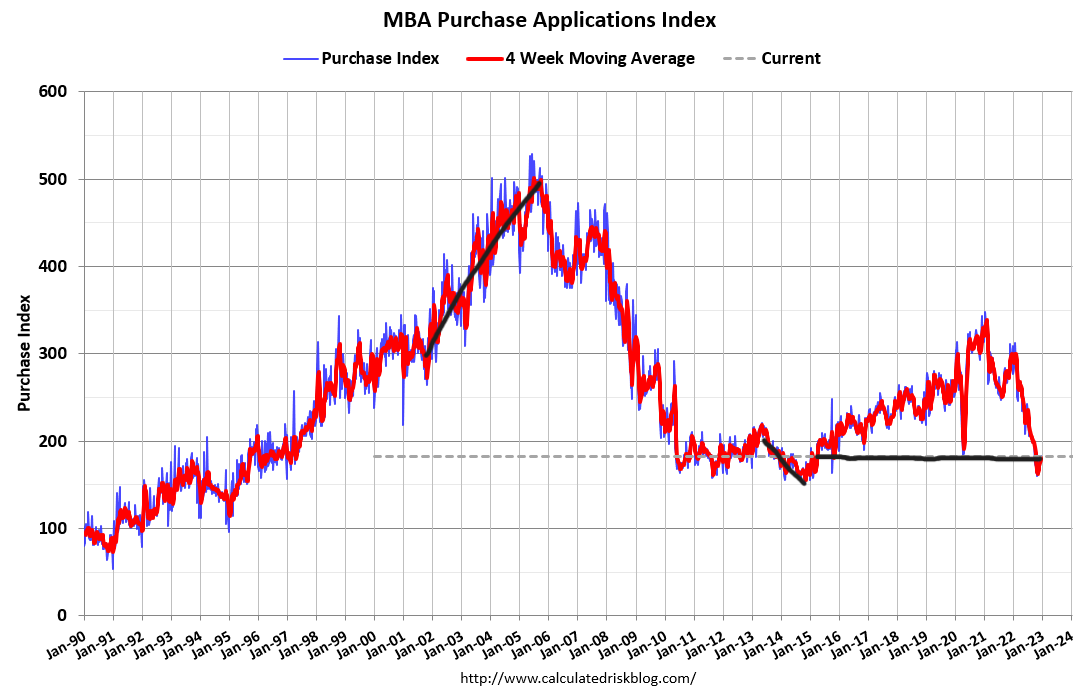
This is a stabilization period for this data line. For this trend to have more value, it needs to continue for 14-18 weeks. The bleeding in purchase application data has stopped. As long as the year-over-year declines get less and less, it’s a positive for the housing market.
Housing market inventory
Altos Research data shows that the weekly inventory fell from 521,957 to 507,934 last week. This is just for single-family residences. To get more details on this data line, check out the Top of Mind weekly podcast hosted by Altos Research founder Mike Simonsen.
One of my beliefs is that housing inventory can have a sustained rise if demand stays weaker over time. The last time we saw this happen was in 2014. Back then, purchase application data went negative for the year, similar to what we saw in 2022.
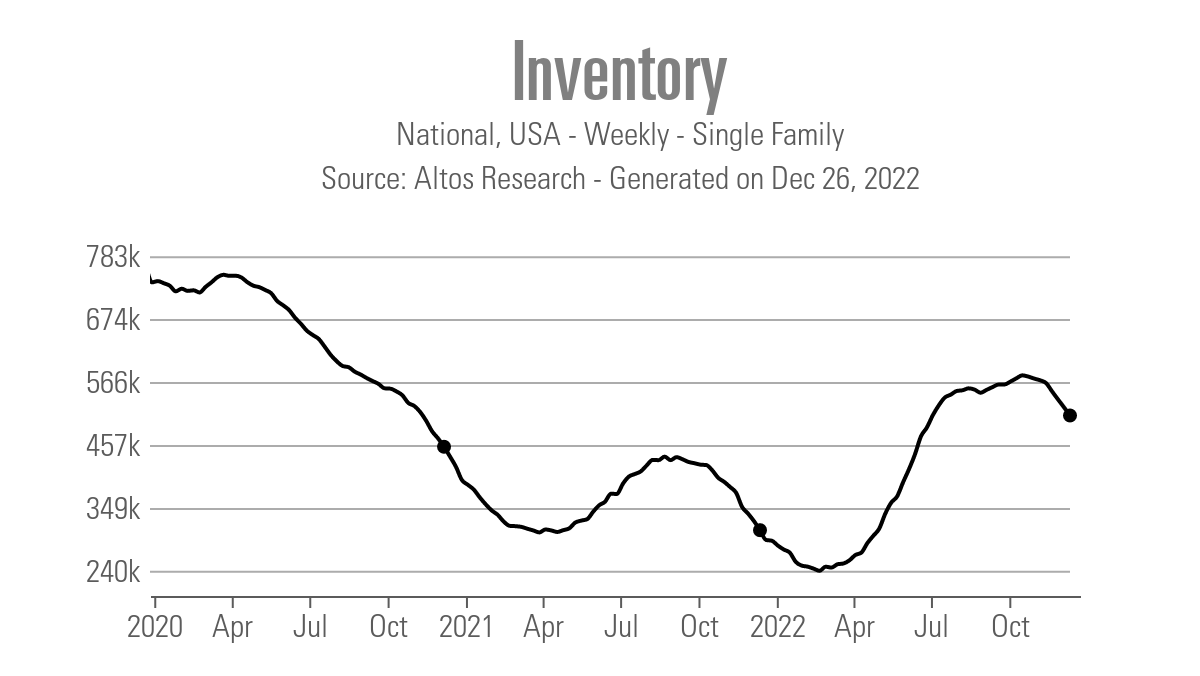
Traditionally, inventory falls in the fall and winter and rises in the spring and summer. We now have a traditional inventory fall, but purchase application data started to rise seven weeks ago. I look at purchase application data as a forward indicator of demand 30-90 days ahead. Since purchase application data started to rise seven weeks ago and it looks out 30-90 days, some of this decline in inventory is due to just better demand, not just the seasonal decline we see at this time.
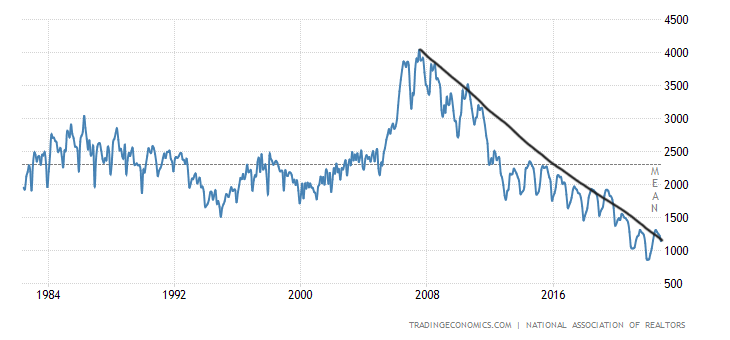
The National Association of Realtors‘ monthly inventory data is presented with the existing home sales reports each month, and it is backward-looking, as are all existing home sales reports. The last four months have seen a decline in the NAR inventory data, which now stands at 1.14 million. We are on the verge of breaking under 1 million again, something that I didn’t think could happen this year with higher mortgage rates, but it looks like this will happen over the next two months. For some context, the all-time low in this data line was at 860,000 in January 2022.
Bond market and mortgage rates
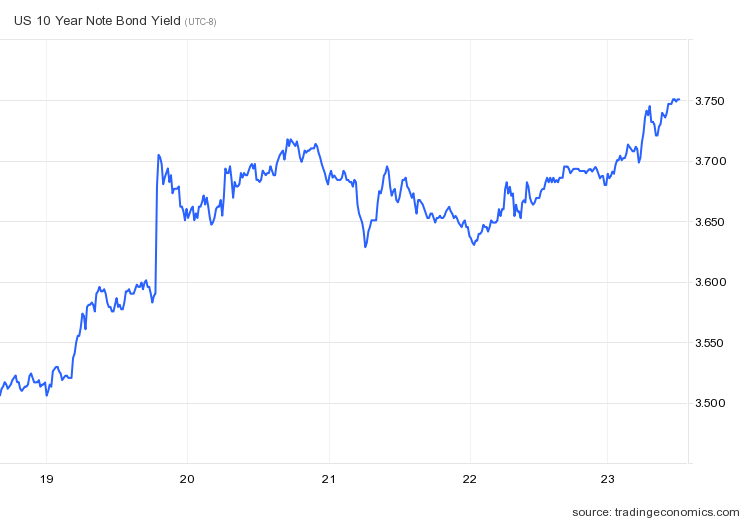
The 10-year yield didn’t have a great week last week: bond yields rose aggressively even with the weaker PCE (Personal Consumer Expenditure) data last week. The news from the Bank of Japan sent a shockwave worldwide, sending bond yields higher earlier in the week.
Mortgage rates, while 1% below the recent highs, have moved up 0.19% basis points from the bottom that occurred on Dec. 15 to 6.32% today, Dec. 26. With transactions that included buy-downs and seller credit to lower rates, the rate some homebuyers are getting is lower than the headline numbers we see daily. However, it was a lousy week for mortgage rates.
As far as housing market economic reports, we have the FHFA House Price Index and the S&P CoreLogic Case Shiller Home Price Index releasing this week. Pending home sales are coming up on Wednesday, and I don’t expect this report to capture the full extent of the recent seven-week push in mortgage purchase application data.
We also have some regional Fed manufacturing data, which has been terrible lately, and the all-important jobless claims data each Thursday. It’s a holiday-shortened week, and the market will be good to go the following week for the start of the year.
The weekly data had two positives and one negative. Purchase application data has found a bottom. I would like to see 14-18 weeks of this kind of action to call it a real trend. We have seen a bottom in the data line, which is a good sign if mortgage rates can head back down toward 5%.
The weekly housing inventory is falling as it traditionally does this time of year, but some of this has to do with better demand. However, unlike the start of 2022, we wont’ start the year at all-time lows in inventory and mortgage rates at 3%. The housing market back then was unhealthy and by February of 2022 I coined the phrase savagely unhealthy because of bidding wars, which escalated higher in January, February and March until mortgage rates started to rise.
The Fed needs to see more balance which I believe we are getting as the days on the market are higher year over year. I am not a fan of the housing market when the days on the market are at the teenager level; this tends to mean we don’t have enough product for the demand out there, and prices can escalate high enough for the Fed to call for a housing reset.

It’s been a crazy year, for sure. We started the year with way too many bidding wars, then saw a massive increase in rates, which impacted demand significantly, only to have rates fall toward the end of the year, showing forward-looking data has stabilized.
Every Monday, I will provide this Weekly Housing Market Tracker with the most current weekly data, taking all housing data one day at a time to make sense of this marketplace