

Tiburon Home Values (Housing Market Trends and Charts)
Realvals
JANUARY 4, 2023
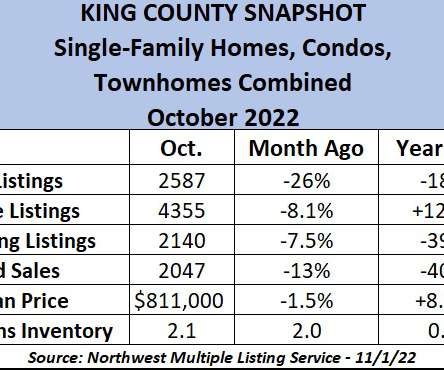
The red line represents the number of listings that are pending, and the numbers at the bottom of the bars show the number of new listings for the month. Tiburon Average Price Per Square Foot of Sold Homes. This is calculated by dividing the number of listed properties by the number of properties sold.


Let's personalize your content