
Appraisers endeavor to take the measure of a neighborhood with a variety of charts and graphs. It helps them to frame the value opinion and see how the subject property relates to the neighborhood or market area as a whole.
A histogram is a graphical display of data using bars of varying heights. In a histogram, each bar groups data for a single variable into ranges (or bins). Taller bars show that more data falls in that range. A histogram may be used to display the shape and spread of the data of the real estate market and illustrate trends of properties that have sold and/or are listed. They’re a great visual tool!
Example
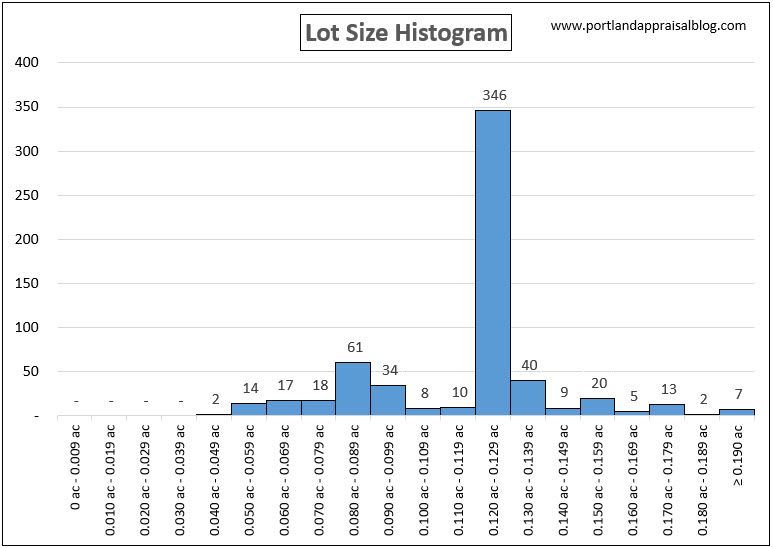
The above histogram depicts the various lot sizes for detached single-family residences in the Ladd’s Addition historic district. The data represents sales and/or listings in the RMLS database from the year 2000 to July 2019. What can we learn from the above chart?
1) There is a tight uniformity of lot sizes in this district. 57% of the data falls into just one bin!
2) 87% of the data falls into the bins representing lots from 0.08 acres to 0.159 acres (~3,485 sq. ft. – ~6,926 sq. ft.). This shows that large lots in Ladd’s addition are rare.
3) Properties outside the aforementioned bins would require more careful analysis by the appraiser (or agent).
4) Dealing with extreme outliers (properties on tiny lots or larger ones for the district) may require the use of a number of data science and appraisal techniques as comparable properties would be hard to find.
5) There is little developer potential for subdividing lots as virtually no lot is large enough to be reasonably partitioned.
Portland Real Estate Market
As you can see, you can squeeze a lot of information out of just one histogram. These charts can be used to display many different variables: age, gross living area, bedroom & bathroom count, sales prices, etc. By evaluating histograms of several key metrics, one can quickly see how a particular property fits into a neighborhood (or district) as a whole.
The Portland market is eclectic and appraising unusual properties requires the careful application of local expertise, the tools of statistics and data science, and sound judgement.
Appraisal Reports
If you are a homeowner and are looking to sell your home, you would greatly benefit from a prelisting appraisal. Our firm will bring high-level analytics to your report and give you a sound understanding of the current market.
If you are an agent and need detailed neighborhood analysis, or analysis of specific areas or specific segments of the market, please contact us and we can generate a custom report to help you frame a listing price for your client!
