June Newsletter-Summer is Here

The official first day of summer is just a few days away, June 20,2021 (summer solstice) but it’s already here as we are already experiencing heat indexes above 100 degrees. We Texans are also panicking because ERCOT is already asking us to conserve our power usage this early in the season. After experiencing the winter storm, none of us want to lose power in this heat! I love soaking up the sun- as long as I get cooled down with reliable air conditioning.
Is the housing market starting to cool? Typically in the summer months, sale volume peaks around June- July. Current market data is yet to show a slowing in the price appreciation or volume. The numbers below are for May. Next month’s newsletter will have the numbers for June. It remains to be seen where the market will peak this year but we are still seeing double-digit increases in both price and volume YoY.
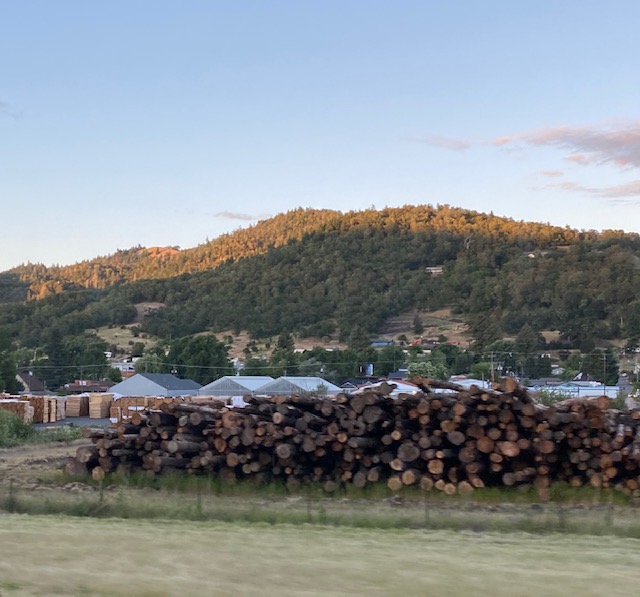
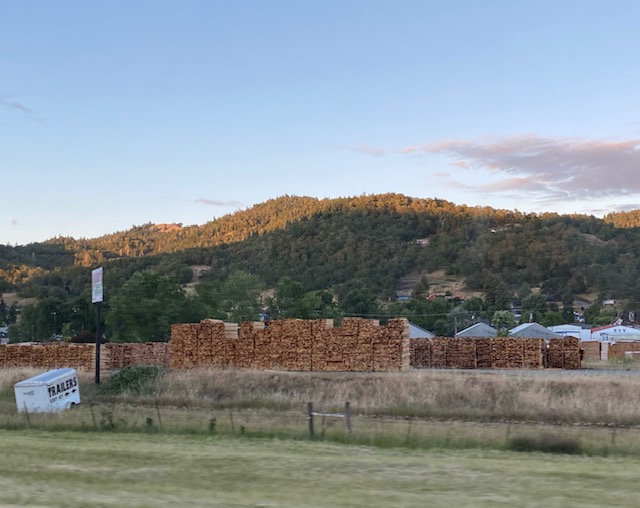
We are still seeing high demand for homes while inventory continues to be at all time lows. Builders are doing their best to build homes but construction costs continue to rise. The only indicator that is showing any sign of slowing down is the cost of lumber which has started to decline. We recently traveled to the states of Washington and Oregon and couldn’t help but notice all of the lumber mills working hard to get lumber out.
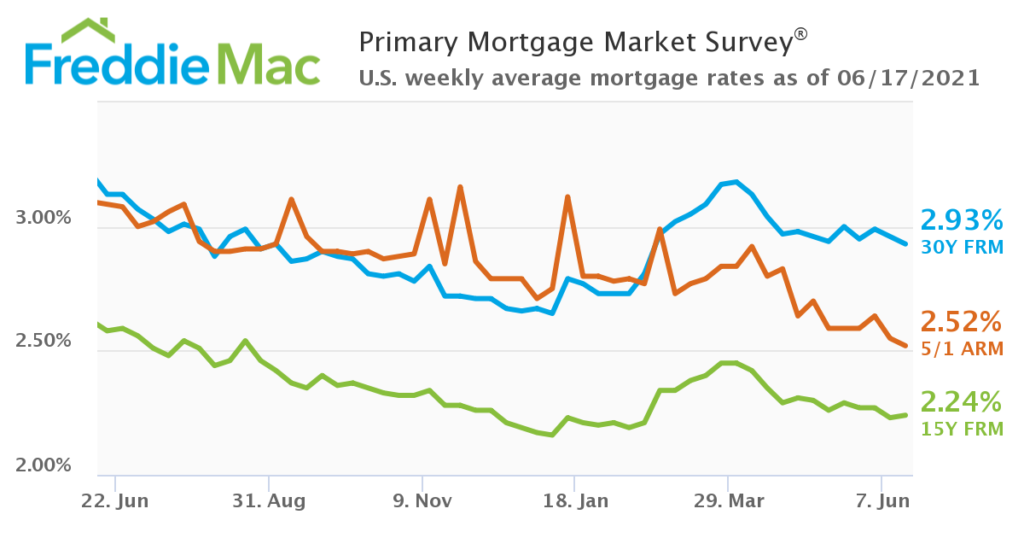
Mortgage Interests remain low as this week, they dropped again with the 30 year fixed rate at 2.93% per Freddie Mac.
Here are the numbers for our local markets:
Median Sales Price
MAY 2021
Denton County
$395,000 | +23.4%
Collin County
$437,000 | +26.7%
Dallas County
$330,000 | +32.0%
Tarrant County
$305,000 | +24.0%
Median Price Per Square Foot
MAY 2021
Denton County
$172 | +18.6%
Collin County
$176 | +23.9%
Dallas County
$181 | +30.2%
Tarrant County
$157 | +19.8%
Volume
MAY 2021
Denton County
1,485 | +16.5%
Collin County
1,685 | +30.5%
Dallas County
2,480 | +42.4%
Tarrant County
2,451 | +20.0%
Months Supply of Inventory
MAY 2021
Denton County
0.7 | -72.0%
Collin County
0.8 | -69.2%
Dallas County
1.1 | -63.3%
Tarrant County
0.8 | -61.9%
Days on Market
MAY 2021
Denton County
4 | -83.3%
Collin County
5 | -80.8%
Dallas County
7 | -66.7%
Tarrant County
5 | -70.6%
Let’s now take a different look at sale volume comparing 2020 to the average number of sales each year. Here is a look at each county
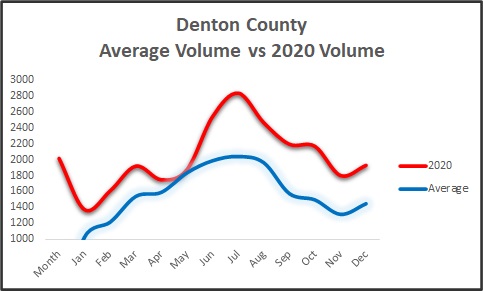
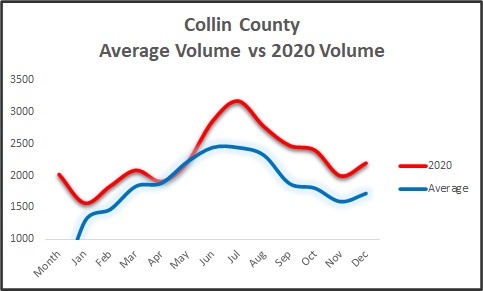
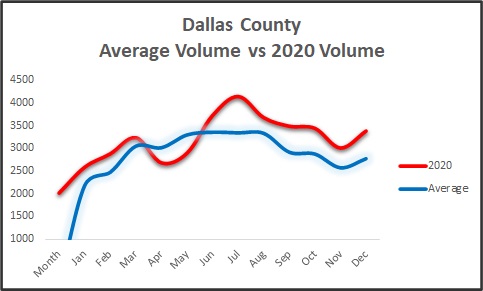
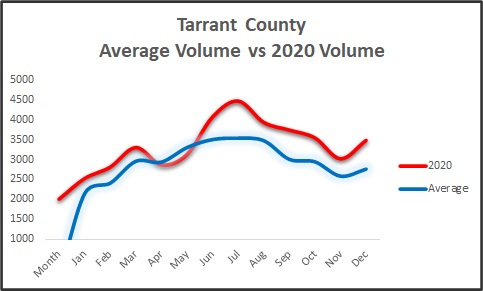
This data is taken from the NTREIS database. You can tell that 2020 has been an exceptional year with greater than average sale volume. The housing market for 2020 was not normal. When will return to a more normal market? Thank you Ryan Lundquist for your blog and recommendation of this data.
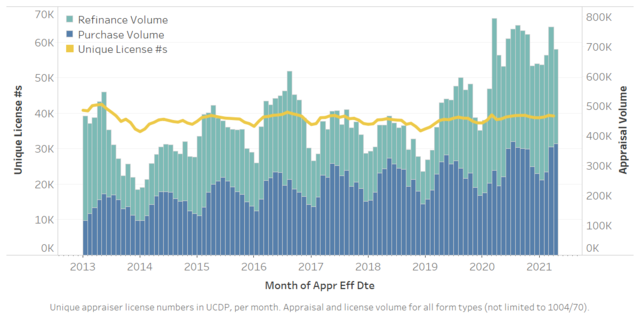
Appraiser Capacity
It’s been a busy year for appraisers, lenders, surveyors, and realtors. As you can see from our charts above, 2020 saw record volume. Freddie Mac just put out this piece on appraiser capacity during the pandemic. This chart depicts the number of refinances and purchases along with the number of appraisers performing them.
We will continue to follow the market trends for the housing market and report them each month. As always, let us know if you have any questions or topics you would like us to discuss. What are you seeing in your markets? Is it the same? Is it beginning to cool?
Check out some of our latest posts on the blog:
- April Newsletter
- March Newsletter 🍀
- Why I Still Love Real Estate Appraising
- February Newsletter
- Merry Christmas & Happy New Year
Want to get the monthly newsletter? Here’s the sign-up!
About The Author
Shannon Slater
Shannon is a Certified Residential Real Estate Appraiser and serves as the Vice President of the DW Slater Company. She joined David at the DW Slater Company in 2006. Shannon graduated Cum Laude from the University of North Texas with a BA degree. Prior to joining the DW Slater Company, she was an Elementary School Teacher for the Pilot Point Independent School District. Shannon is an FHA Certified Appraiser. Shannon is a designated member of the National Association of Appraisers and a member of the Association of Texas Appraisers. In her free time, Shannon enjoys spending time with her family, singing in a local church choir, and tandem cycling with her husband.