

The South Portland neighborhood is one of Portland’s waterfront communities, bordering the Willamette River. It is connected to the east side of the city via four bridges and boasts some of the city’s modern skyscrapers—including the John Ross Tower, Portland’s largest residential structure. Shopping, fine dining, numerous parks, recreation, OHSU with its aerial tramway, and major employment centers are all features of this dynamic neighborhood.

Despite being part of Portland’s urban core, the South Portland neighborhood has a thriving detached single-family home market.
Appraisers endeavor to take the measure of a neighborhood with a variety of tables, charts, and graphs. It helps them to frame the value opinion and see how the subject property relates to the neighborhood as a whole. Before we dive in, a…
Quick Note
The following information is based on detached single-family residential homes that were sold and/or listed on the open market as reported by RMLS—the primary MLS service for the City of Portland. Data was pulled from the year 2000 to the present date. The data export was checked, validated, and scrubbed of obvious errors using custom tools developed by the author. With that out of the way, let’s look at some neighborhood stats.
Neighborhood Statistics Overview
The following table summarizes important metrics for the neighborhood. Each column is independent of the others and the basement square foot column reflects only properties with a basement.

There has been relatively little new construction in the neighborhood with ~5.8% of all sales having been new homes.
The following scatter plot shows all closed-sale detached single-family residences (with a red trendline):

The neighborhood suffered during the housing crisis, but has recovered with prices generally higher than they were before the crash. The red trendline shows prices have leveled and have even dipped a bit. This is further borne out by a review of average and median sales prices over the last two years:

Percentile rank is a way of seeing price bands for the neighborhood. For instance, the 50th percentile, or median rank, shows that half of all sales since the year 2000 have been under $359,000. Prices are fairly clustered up to the 90th percentile where the upper range begins to balloon:

The following table shows important marketing information for both the last two years and since the year 2000:

The “SP/OLP” label stands for “sales price/original list price” ratio. This is an important metric, as it shows what the particular property sold for relative to the original list price that was advertised. The “SP/LP” column tracks what the sales price was relative to the final published list price. This column, while not as important as the first one, still yields important insights as to the direction of negotiations. The “DOM” column tracks the days on market for all properties sold and listed and helps frame expected marketing time. Finally, the “CtL” label stands for “contract-to-list” ratio. It is the number of pending sales divided by the total number of listings. A low ratio means many properties are sitting on the open market waiting for offers. A high ratio indicates properties are being absorbed by the market quickly, commonly referred to as a “seller’s market.”
As of this post date, there are more properties waiting for offers than are under contract. The CtL is a fluid metric, however, and may not be indicative of long-term trends.
The following table more closely examines DOM as well as CDOM (cumulative days on market). CDOM is also an important metric as homes are often taken off the market and then subsequently relisted (typically at a lower price). The CDOM metric can give you a better idea of total expected marketing time. The table breaks out DOM & CDOM by price segment:

Let’s wrap up the neighborhood statistics overview with the following table showing the sales terms in the market over the last two years:

While conventional financing is predominant, there is a substantial cash market.
Let’s conclude our tour of South Portland with a histogram analysis of the neighborhood:
Histogram Analysis
Age

Most properties in the neighborhood are over a half century old. With the oldest home being a 920 sq. ft. cottage built while Abraham Lincoln was still president of the United States.
Bathroom Count
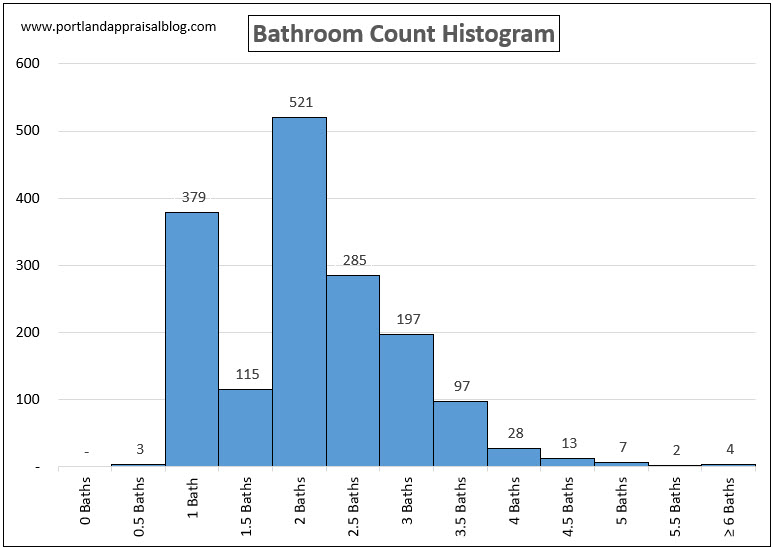
A two-bathroom home is the most typical for the market, with a single bathroom being fairly common as well.
Bedroom Count
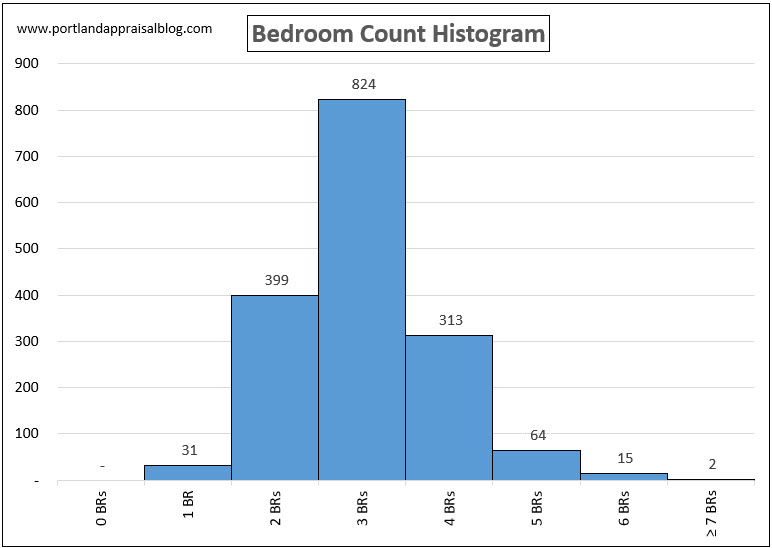
The vast majority of homes are have three bedrooms.
Garage Stall Count

There is near parity between properties with no garage and a one-car garage. A two-car garage is not uncommon either.
Total Square Footage

This metric includes above-grade living area and basement space for a combined figure. The median total square footage for the neighborhood is ~2,200 sq. ft.
Gross Living Area

Gross living area only consider non-basement living space. Often the market reacts more strongly to gross living area, usually applying a discount to basement space. Median gross living area is approximately 1,550 sq. ft.
Level Count

The majority of properties are three levels in this neighborhood.
Lot Size

The lion’s share of properties are on lots 0.06 ac – 0.119 acres (~2,610 sq. ft. – ~5,180 sq. ft.).
Sales Price

This histogram includes sales prices over a 20-year period. The median sales price over the last 20 years is: $359,000; and the median sales price over the last 2 years is: $530,533.
The highest sales price obtained in the neighborhood (on the open market) was $1,500,000 on 6/13/2018. The home is over 6,000 total square feet; sits on one of the larger lots for the neighborhood; has a sauna & pool; and has a studio!
# of Sales

The number of sales in the neighborhood have been trending lower this year as compared to the previous two.
So, there you have it, a market overview for the South Portland neighborhood!
Appraisal Reports
If you are a homeowner and are looking to sell your home, you would greatly benefit from a prelisting appraisal. Our firm will bring high-level analytics to your report and give you a sound understanding of the current market.
If you are an agent and need detailed neighborhood analysis, or analysis of specific areas or specific segments of the market, please contact us and we can generate a custom report to help you frame a listing price for your client!
