Unlocking the Basics: Part 2 of Housing Statistics for Beginners
In my last blog post, which was the first installment in this multi-part series, I discussed why it is important for agents to be aware of local housing statistics. We see national news stories that say this or that about the housing market, however, it may or may not reflect what is going on in our neck of the woods.

We all know that the three most important factors in real estate are location, location, and location. If this is true then we need to have a grasp on the different market indicators for our local market.
Even though city-wide data can be helpful it is important to be able to drill down even more to the local market level. In appraising we analyze the competitive market area that our property is located in and when discussing housing stats it’s important to study the housing numbers at the same level.
In the Birmingham, Alabama metro area, where I work, supply and demand may be at a certain level but it may be totally different in various cities or neighborhoods.
A great skill to have for a real estate agent, or anyone in the real estate industry, is the ability to download sales data from your local MLS and import it into a spreadsheet program like Excel or Google Sheets. I know that there are other similar types of programs available so if you are familiar with another one feel free to use it.
This blog series is not meant to be a tutorial on how to use any specific program, however, if you have any questions please let me know. I do have some videos on my YouTube channel that teach some basic graph-making skills so you can also refer to them HERE.
When learning a market it is very helpful to be able to perform an MLS search and download the data for analysis. This will give you the best data on the area in which your listing is located rather than data based on a larger market area such as your city, state, or country, because that can show different results.
In my last post, I discussed statistics related to supply and demand. In this post we’ll discuss Average and Median Sold Price, Average Days on the Market (DOM), and Months of Inventory.
Sources of Data
There are various sources of data that you can use to obtain housing information, however, it may not be possible to drill down to the neighborhood level on many of them. I believe that it is important for agents to be aware of the market on a city level as well as a neighborhood or subdivision level.
City-wide information will give you a bird’s eye view of the market but like I said this may not tell you the full story of what is occurring in the neighborhood where your listing is located. Both views are important and you’ll need to know both to have a full understanding of the market.
Some data sources like Redfin and Altos provide statistics on the bigger picture, however, I have found that the local MLS is best for providing the most accurate data at the subdivision or neighborhood level. Your market may have other sources of market data as well.
The Alabama Center for Real Estate provides helpful charts and statistics from data it gets from The Alabama Association of Realtors. Your state may also have something like this that helps you see the big picture.
When looking at city or area-wide data it can be helpful to get the perspective of multiple services, however, the MLS provides the most comprehensive sales information when analyzing specific subdivisions and neighborhoods.
Average and Median Sold Price
By analyzing sales trends we can get a better understanding of what is happening in the market we are studying. The average and median sold price of homes can help us to see what trends have been occurring as well as help us to see where the market might be headed.
The average sales price is calculated by simply adding up the sales prices of all of the homes and then dividing by the number of homes sold. The average sale price will factor in the outlier sales which could possibly skew the results.
If you have more sales in either the upper or lower tier of properties then this could possibly give you misleading information. More sales in the lower price bracket may indicate a decline in prices and more in the upper range may indicate an increase. While it may provide you with a general understanding of the overall market it may not help you understand the market for your specific property if it lies within the mid-range.
On the other hand, the median sales price of homes will provide you with a better understanding of the midpoint because it eliminates the outliers. The median sales price reflects the middle point in a range of home prices and offers a better measure of the typical property value.
Both the average and median sold price will give you a clearer picture of the market. It can help you understand price trends as well as the effects of outlier sales on those trends.
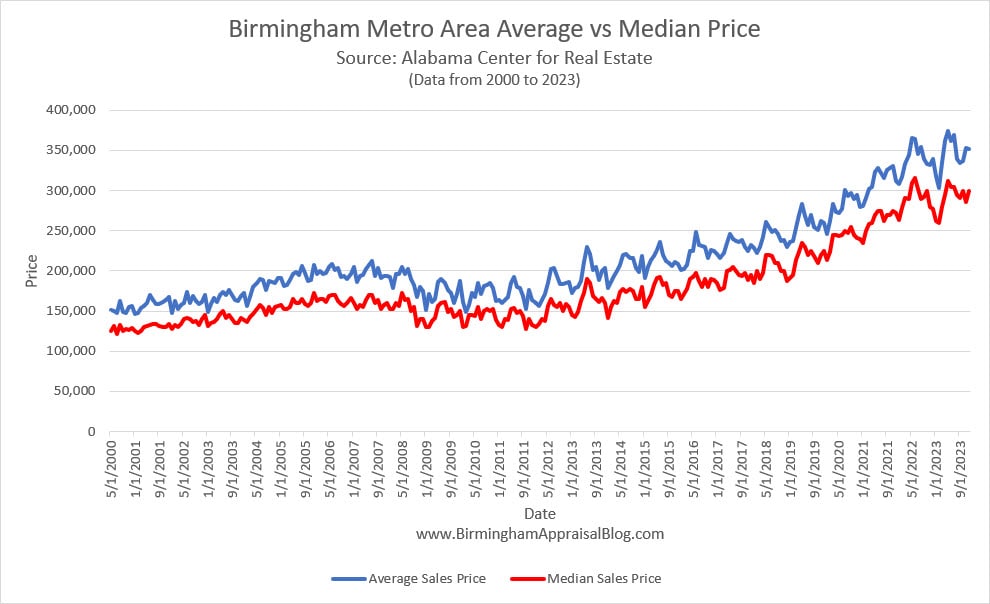
The data in the above graph is for the Birmingham Metro Area and reflects approximately 23 years’ worth of sales. The same type of graph can be created for the specific neighborhood you are working in and it will give you a street-level view of the market, which may be different from the city or area it is located in.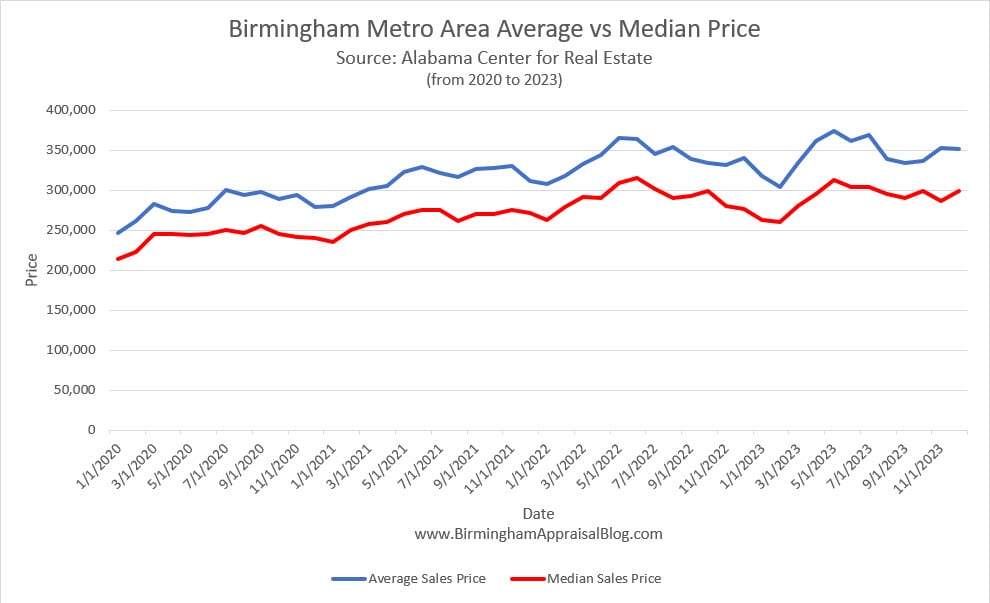
The second graph shows average and median price trends over a shorter time period, from 2020 to the end of 2023. By looking at this shorter period of time you will get a better understanding of the current market, and what has happened since Covid, which has become a significant time period in the current housing environment.
The graphs reflect some seasonality from month to month during the year, however, they also show the overall trend of market activity. This is important information to know in the pricing process.
Days on Market
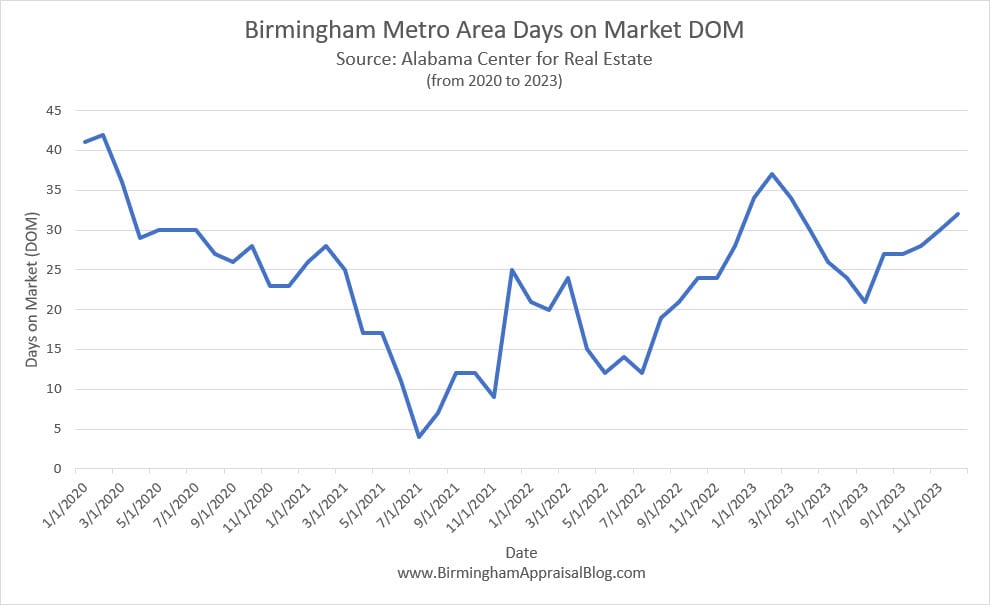
The second metric we’ll look at is Days on Market, or DOM. Knowing the DOM trend for sold properties is important because it helps us understand how quickly or slowly homes are selling in a particular area.
Knowing the DOM and the DOM trend helps with pricing strategy in the following ways:
1) Market Awareness: By looking at the DOM trend for recently sold properties, we get a better understanding of how long it typically takes for homes to find buyers in a specific neighborhood. If homes are selling quickly, it suggests a high demand, and if they’re taking longer, it might indicate lower demand.
2) Setting Competitive Prices: Being aware of this important stat helps to set competitive and realistic prices for listings. It’s important to remember that most stats by themselves offer little help in understanding the market but together they can provide us with valuable information to help in pricing a home to the market.
3) Avoiding Overpricing: If the DOM trend for sold properties in the area is longer than normal, it signals that buyers are taking longer to make a purchase decision and demand may not be strong. This information can be used to advise sellers on how to price in this situation. On the other hand, if the days on the market for competitive properties are short and inventory is low this may indicate a less conservative pricing strategy. Again, we must look at the combined stats before making a final decision.
In simple terms, understanding the Days on Market trend for sold properties helps us stay in tune with the local market’s pace. It provides a guide in setting prices that align with buyer expectations, increasing the likelihood of a quicker and more successful sale.
Months of Inventory
The last metric we will discuss in this second part of my series on real estate statistics is Months of Inventory. The “Months of Inventory” is a real estate statistic that tells you how long it would take to sell the current inventory of homes on the market, given the current sales pace and if no other sales were added. It’s a simple way to understand the balance between supply (homes available for sale) and demand (homes being bought).
Here are several reasons why this metric is important:
1) Market Conditions: It provides a sense of whether the market is leaning towards being a buyer’s market or a seller’s market. In a buyer’s market, where there’s an excess of homes and fewer buyers, prices may be more negotiable. In a seller’s market, where there are more buyers than available homes, prices might be higher.
2) Pricing Guidance: If there are fewer months of inventory (indicating high demand and a seller’s market), it might be realistic to set a slightly higher listing price because buyers are competing for limited options. Conversely, in a buyer’s market with more inventory, a more competitive list price might be necessary to attract buyers.
3) Avoiding Overpricing or Underpricing: Understanding the Months of Inventory will help sellers avoid overpricing in a slow market where it might take longer to sell. In a fast-paced market, sellers can avoid underpricing, ensuring they get a fair value for their property.
In simple terms, the Months of Inventory is like a thermometer for the real estate market. It helps agents and sellers gauge the temperature of the market, and knowing this helps them determine the most effective pricing strategies for selling their homes.
The following is a trend graph for Months of Inventory for the Birmingham metro area.
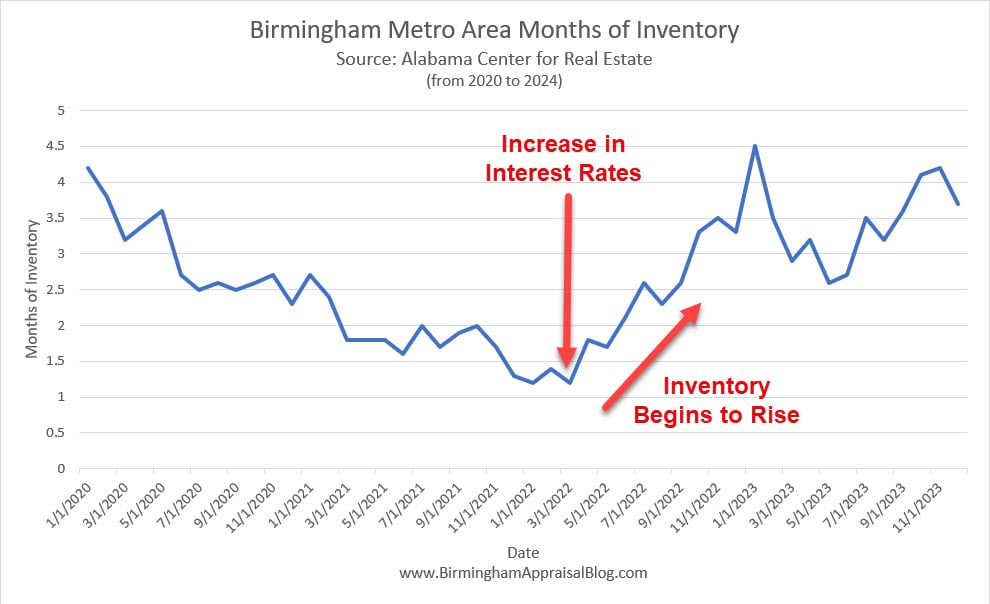
As you can see, inventory levels in the Birmingham Metro Area were at a very low point in the first quarter of 2022, however, when interest rates began to rise so did months of inventory. If interest rates decline in 2024 as some economists predict we may see yet another decline in Months of Inventory.
Conclusion
Understanding these housing statistics along with others helps navigate the real estate market. It allows agents and appraisers to make informed decisions whether it be for developing an opinion of value or a list price. If you have any questions feel free to contact me and as always, thanks for reading.
I dig the chart over 20 years for the avg and median. Nice!!!
Thanks, Ryan.
This is great information for agents. The only thing that I would also look at is the CDOM (cumulative or total DOM) for sales that have DOM that exceed the median DOM. In many cases, I find that there have been one or more price reductions. In this case, I provide additional information as to the Total DOM and DOM since the last price change. In most cases, I have found that DOM since the last price change is similar or less than the Median DOM. As you stated, don’t over price houses or they will just sit on the market.
Thanks, Pierce! Great point on CDOM, thanks for mentioning it.