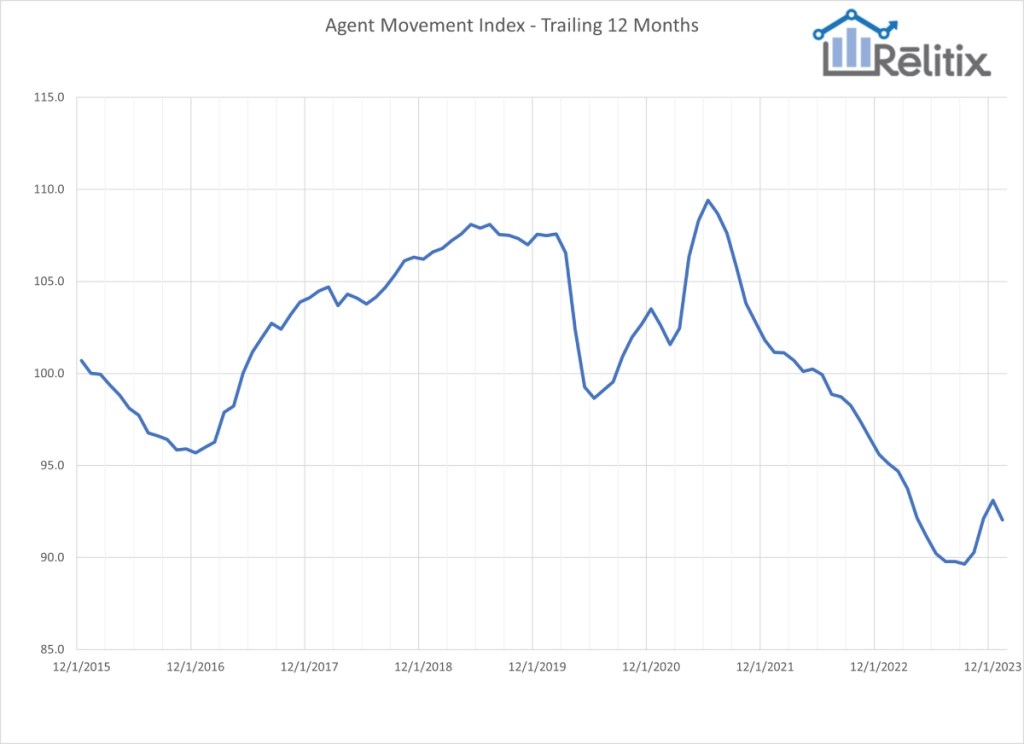
With market uncertainty, real estate agents had been sticking with their current brokerage, but that’s all starting to change. While inventory is still low, professionals are seeing light at the end of the tunnel. The Relitix Agent Movement Index continues to rise on a seasonally adjusted basis as agents begin switching brokerages at a faster rate than 2023.
As confidence in the 2024 housing market grows, so does agent’s confidence in their ability to make a move to a new broker. According to Relitix, the market is ramping up to peak movement month which usually occurs in March after the slow holiday season.
Agent Movement Index – Trailing 12 Months
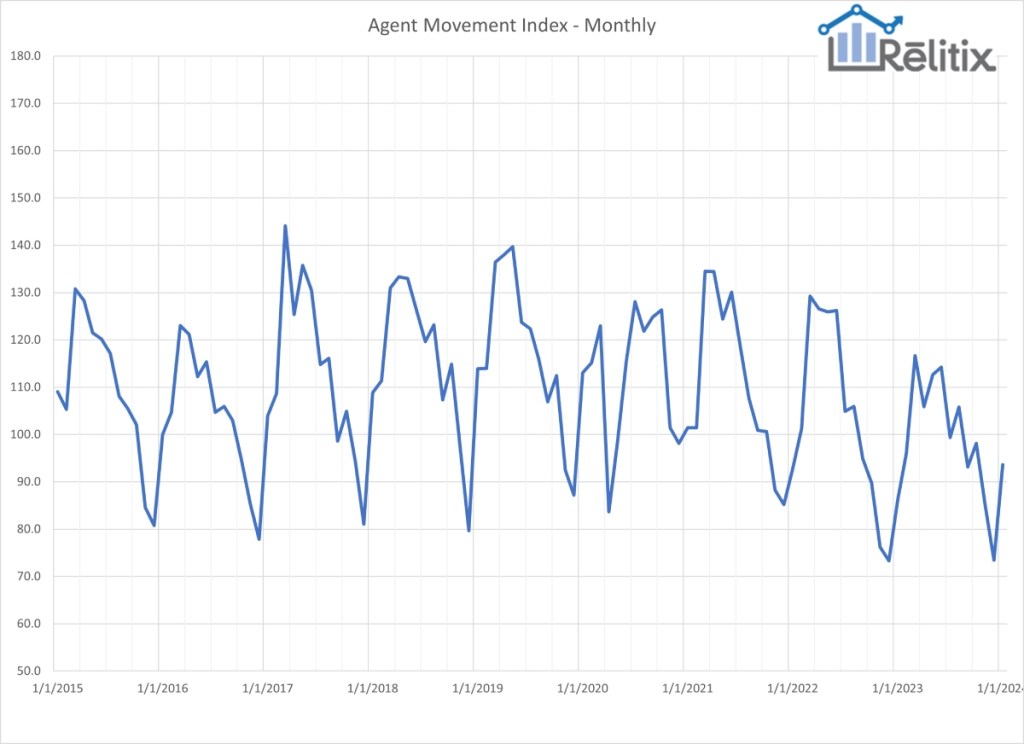
The monthly AMI value finished at 93.6 for January with a seasonally adjusted value of 91.5. The December values were revised upward to 73.5 and 89.8 respectively.
Trends in the relative movement of experienced real estate agents between brokerages are an important strategic consideration for brokerage and franchise leaders. The relative amount of movement fluctuates over time on a seasonal and long-term basis.
Methodology: The Agent Movement Index is published monthly and features monthly and seasonally adjusted, and 12-trailing-month values. The index is calculated using national-level data from a large sample of the nation’s most prominent MLS systems. The agent movement reflects the relative mobility of experienced agents between brokerages. The score is computed by estimating the number of agents who changed brokerages in a given month. To be counted the agent must be a member of one of the analyzed MLS’s and change to a substantially different office name at a different address. M&A-driven activity and reflags are excluded as are new agents and agents who leave real estate. Efforts are made to exclude out of market agents and those which are MLS system artifacts. The number of agents changing offices is divided by the number of agents active in the past 12 months in the analyzed market areas. This percentage is normalized to reflect a value of 100 at the level of movement in January 2016 (0.7313%). The seasonally adjusted value divides the monthly result by the average of the same month in prior years.
Analyzed MLS’s represent over 800,000 members and include: ACTRIS, ARMLS, BAREIS, BeachesMLS, BrightMLS, Canopy, Charleston Trident, CRMLS, GAMLS, GlobalMLS, HAR, LVAR, Metrolist, MLSListings, MLSNow, MLSPIN, MRED, Northstar, NTREIS, NWMLS, OneKey, RealComp, REColorado, SEF, Stellar, Triad, Triangle, and UtahRealEstate.
Rob Keefe is founder of Relitix Data Science.

