Real estate agents are continuing to stay put, moving much less between brokerages than the post-pandemic peak seen in the summer of 2021, according to the latest Relitix Agent Movement Index.
The index shows the relative degree of movement between brokerages by experienced agents and is indexed to the level of mobility in January 2016. The graph shows that, on a trailing 12-month basis, mobility hit its 10-year high in June 2021 at an index value of 109.4.
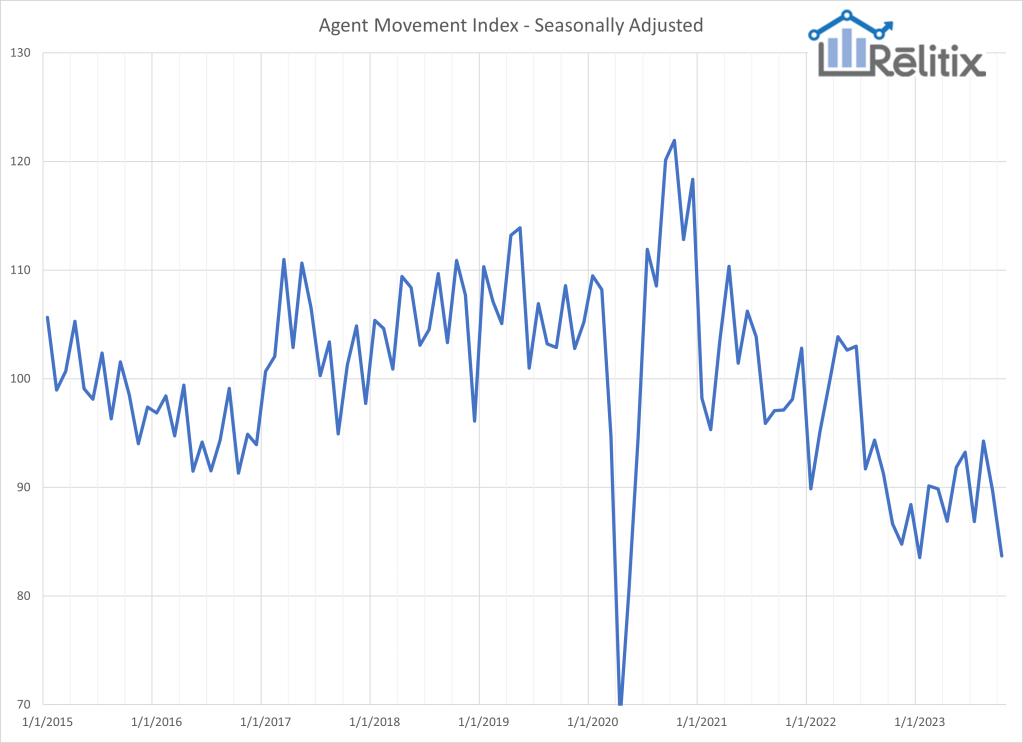
The most recent trailing 12-month value shows a new low of 89.4, representing a decline in annualized movement of agents of over 18%. This is where the seasonally adjusted values also indicate a new low in the movement of agents between firms.
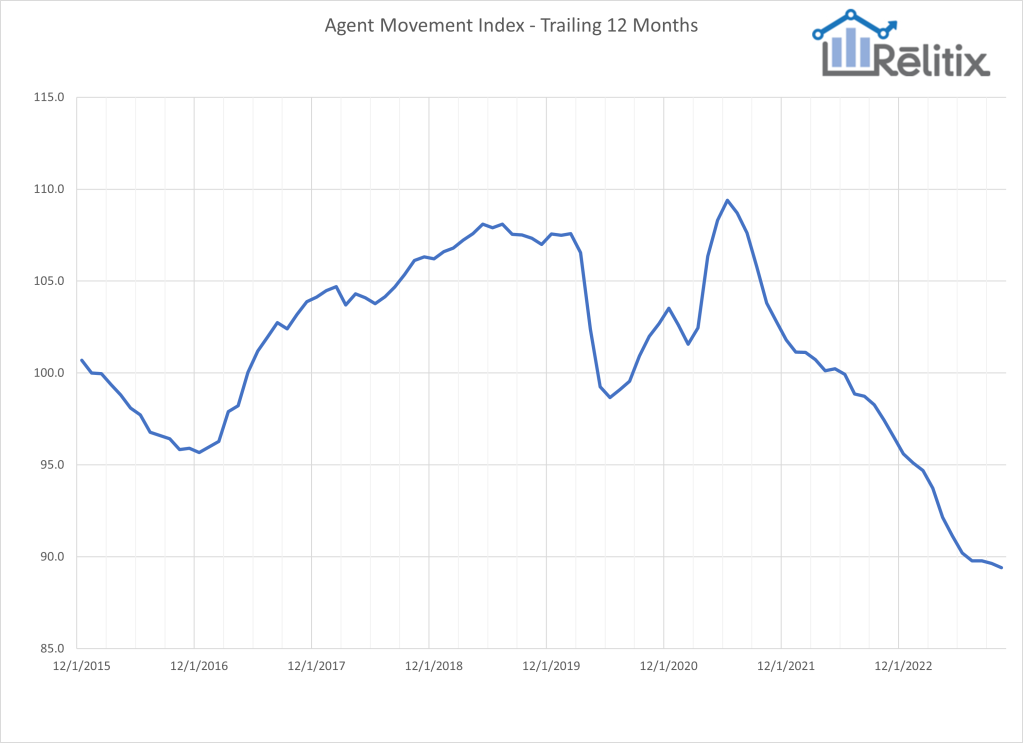
In October, we called a bottom to the declining trend of agent movement. It now appears that was premature as the decline continues. The combination of slowing movement and fewer active agents means that we can expect a very quiet few months as we enter the slowest two months of the year.
The monthly AMI value finished at 93.1 for September with a seasonally adjusted value of 88.5.
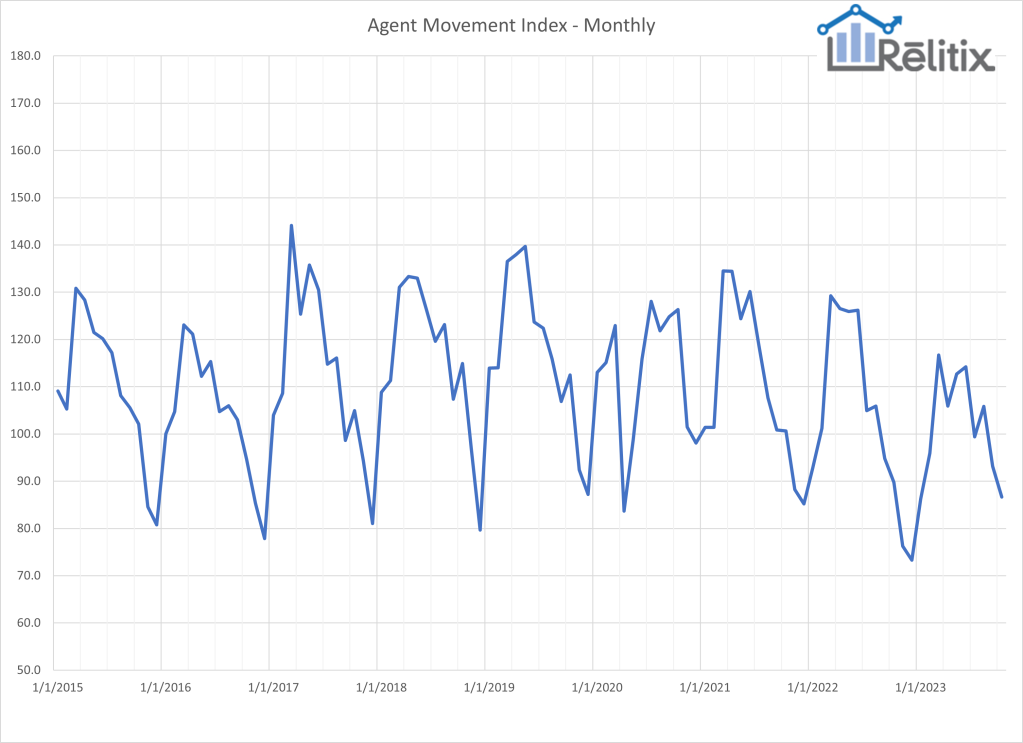
Trends in the relative movement of experienced real estate agents between brokerages is an important strategic consideration for brokerage and franchise leaders. The relative amount of movement fluctuates over time on a seasonal and long-term basis.
Methodology: The AMI is published monthly and features monthly and seasonally adjusted, and 12-month trailing values. The index is calculated using national-level data from a large sample of the nation’s most prominent MLS systems. The agent movement reflects the relative mobility of experienced agents between brokerages. The score is computed by estimating the number of agents who changed brokerages in a given month.
To be counted the agent must be a member of one of the analyzed MLS’s and change to a substantially different office name at a different address. M&A-driven activity and reflags are excluded as are new agents and agents who leave real estate. Efforts are made to exclude out of market agents and those which are MLS system artifacts.
The number of agents changing offices is divided by the number of agents active in the past 12 months in the analyzed market areas. This percentage is normalized to reflect a value of 100 at the level of movement in January 2016 (0.7313%). The seasonally adjusted value divides the monthly result by the average of the same month in prior years.
Analyzed MLS‘s represent over 800,000 members and include: ACTRIS, ARMLS, BAREIS, BeachesMLS, BrightMLS, Canopy, Charleston Trident, CRMLS, GAMLS, GlobalMLS, HAR, LVAR, Metrolist, MLSListings, MLSNow, MLSPIN, MRED, Northstar, NTREIS, NWMLS, OneKey, RealComp, REColorado, SEF, Stellar, Triad, Triangle, and UtahRealEstate.
Rob Keefe is founder of Relitix Data Science.

