Mastering the Game: Why Housing Statistics Are Your Secret Weapon in Real Estate
Hey there, fellow real estate pros! In the fast-paced world of house sales and market trends, staying ahead of the game is everything. As someone knee-deep in residential real estate appraisal, I’ve got a nugget of wisdom to share: housing statistics are your not-so-secret weapon for leveling up in the real estate hustle. In this blog post, that I’ve written specifically for real estate agents, we’re diving into why understanding housing stats is like having a secret weapon in your professional toolkit—it’s a game-changer!

Why Bother with Housing Stats? Quick Lowdown for Real Estate Agents
Let’s keep it real—real estate is more than just bricks and mortar changing hands. Navigating the real estate landscape involves understanding market dynamics, buyer behaviors, and economic indicators. Housing statistics function as the orchestrator, providing the structured beats of market trends, property values, and relevant data.
For agents, housing statistics are more than a mystery of charts and numbers; they’re your ticket to playing the game smart. Forget the jargon; we’re talking about understanding what those numbers mean and using them to guide you in helping your clients, whether they are buying or selling.
In this blog series, we’re on a mission to make housing stats less of a head-scratcher and more of a go-to tool in your kit. From average home prices to how long a property hangs out on the market, inventory levels, and beyond—each stat packs a punch of info ready for you to cash in on.
Being on top of these stats isn’t about impressing anyone at a cocktail party (though it might). It’s about you, the agent, making killer decisions. Think nailing spot-on listing prices, crafting marketing moves that actually work, and negotiating like a champ. It’s about being that go-to pro who doesn’t just talk property listings but understands the rhythm of the market.
So, kick back, enjoy the ride, and get ready to crack the code of housing stats. This is your passport to not just surviving but slaying it in today’s everchanging real estate market. Kudos to mastering the game through the lens of housing stats!
Real Estate- It’s All Local
Being a savvy real estate agent means tuning into the local vibes rather than getting lost in the big-picture stats. Sure, state and national info might give you the 30,000-foot view, but the real gold lies in understanding what’s happening in your own backyard.
Why? Well, let’s keep it real. Local real estate is like a different language – each neighborhood has its own story. Knowing the local numbers means you’re not shooting in the dark. It’s like having a map that guides you through the unique buying preferences of the people living there.
Think about it this way: state or national stats might say one thing, but your town or area (neighborhood) could be telling a different story. Maybe there’s a hot new spot that everyone’s eyeing, or perhaps there’s a trend where certain features are a big deal to locals. If you’re in the know about these local nuances, you’re not just an agent; you’re a neighborhood expert.
Understanding local real estate stats is like having a secret weapon. You’re not making blind moves; you’re making informed decisions. Whether it’s setting the right price, pinpointing promising spots for your clients, or being the go-to guide for anyone looking to buy or sell, your success is tied to knowing the ins and outs of your local market.
Housing stats is not a one-size-fits-all topic. Dive into the local numbers, and watch how being a neighborhood expert transforms you into a more successful and effective real estate agent. Your clients will thank you for not just knowing the market but understanding their community like the back of your hand.
In this multi-part blog series, we’ll be discussing key housing statistics that include the average and median sold price, average days on the market, number of active listings (existing inventory), pending listings, months of inventory, closed sales, sale price to list price ratio, and price per square foot.
In this first installment, we will discuss the number of active listings and sales, which make up supply and demand.
Number of Active Listings, or Supply
The number of active listings, or supply of homes, is important because it sets the tone of the market. A larger number of listings in comparison to buyers creates a buyer’s market.
Buyers have many choices and have a lot of houses to choose from. This creates an oversupply issue, which forces sellers to compete for a limited number of buyers. This usually results in prices being lowered to get the attention of buyers.
When the opposite occurs and there are more buyers than inventory of homes we see a different scenario. This is considered a seller’s market.
It is characterized by a limited inventory of homes and a large number of qualified buyers. This type of market occurred after the COVID-19 pandemic was announced.
Interest rates were lowered to stimulate the market and entice buyers. Because of the limited inventory relative to the number of buyers prices were driven up due to buyer competition.
The interest rate hike that occurred in the first half of 2022 put the brakes on this, and the market has been struggling since then to gain some of the sales volume that was lost.
Let’s take a look at supply and demand trends in the Birmingham metro area with the following graphs.
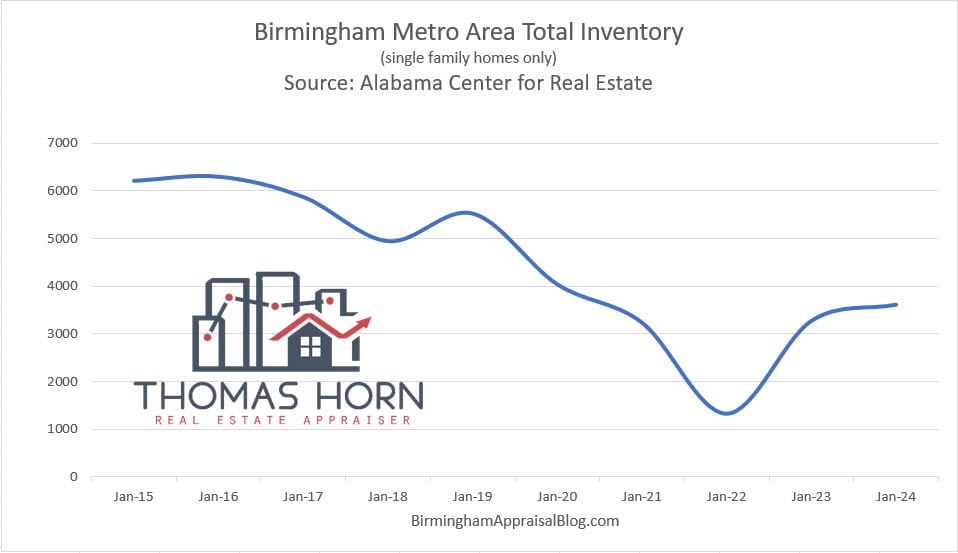

Keep in mind that these graphs are for the Birmingham metro area as a whole. While these graphs are much better at telling the story of what is happening locally it may still not reflect what is occurring in the specific neighborhood that you are working in.
By utilizing local MLS data it is possible to recreate these types of graphs for the specific municipality or neighborhood your property is located in. Because real estate is location specific it’s possible that city-wide data may be different than neighborhood data so it is important to drill down to the competitive market area that your property is located in.
When this is done you are able to use sales data that can help you answer important questions regarding the supply and demand of homes in the area you are working. This will help in accurate pricing and will aid in pricing a home to the market which will allow you to sell it for the best price possible in the shortest amount of time.
Accurate sales data will help you determine inventory levels and sales demand. If the data shows you that there is an oversupply of homes then you might want to be more conservative in your pricing so that it will be competitive.
On the other hand, if inventory is tight and buyer demand is high then you can afford to price it higher to reflect this. The only way you will know this is by analyzing the sales in the subject’s competitive market area so that the data reflects the market your home is located in.
Home Sales Equals Demand
The number of homes that have sold within a certain time period provides a measure of the demand for housing in a specific location. The number of sales occurring over a period of time (sales trend) can also provide you with some context as to what direction the market might be headed.
Again, the number is relative to where the home is located. Home sales can vary by area within the same town or city and can be influenced by school systems, nearby amenities, or unique features of the neighborhood.
As noted above, outside influences such as mortgage interest rates can have a huge impact on the number of sales occurring. If there is significant inventory and low interest rates the number of house sales will increase.
In addition to the above factors, seasonality can play an important role in sales trends. If you look at monthly sales of homes over several years you will see a pattern at the same time each year.
Knowing what time of year has the most sales can help you develop an effective pricing strategy and marketing plan.
Another stat that is helpful to keep up with is that of pending sales. A large number of pending sales in one month will give you an early preview of what closed sales will look like in the next 30-45 days, depending on how long it takes them to close.
Conclusion
I hope this information on supply and demand has been helpful to you. In the next blog post, we will look at some other statistics that will help you make informed pricing decisions. If you have any questions feel free to contact me and as always thanks for reading.
I too am looking forward to the rest of this series. I am working on upping my data game as well, so inspiration on what charts/graphs to show as we analyze the market is definitely helpful!
Thanks, Jason for reading.
Hey Tom,
Great topic. Looking forward to the rest of the series
Thanks, Joe!
Great insight! I am looking forward to the rest of this series!
Thanks! Appreciate you stopping by and reading!
Happy New Year, Tom. I’m looking forward to your data and the visuals you create this year. Data = power. Not every is a stats person, but anyone in real estate really needs to pay close attention to understand the story of the market. Keep up the great work!!
Thanks, Ryan. Happy New Year to you as well. I appreciate all you do to support real estate professionals in their quest to know the market with data and visuals.