Final Insights on Housing Statistics for Real Estate Agents
We are in the last part of my Housing Statistics for Beginners series and I want to thank you for following along. Knowing what the stats are and how to find them is very important in analyzing the real estate market because it helps us make informed decisions on pricing a home.

In the first installment, we discussed the number of active listings as well as sales. These stats make up what we know as supply and demand.
Real estate professionals must grasp supply and demand statistics to accurately gauge market dynamics, ensuring they price homes competitively. Understanding these metrics enables agents to adjust pricing strategies based on inventory levels and buyer demand, optimizing the chances of selling a property quickly and at the best possible price.
In the second post of my series, we covered average and median sold prices, average days on the market, and months of inventory. It’s important to consider all of these stats together rather than as single stats because they all work together to help us understand buyer and seller behavior.
Being aware of the average and median sold prices, average days on the market, and months of inventory statistics allows real estate professionals to price listings more accurately, reflecting the nuances of local market conditions and buyer preferences. Armed with this detailed insight, agents can craft pricing strategies that not only attract potential buyers but also maximize the seller’s return on investment by accurately reflecting the property’s value within its specific market.
In this third part of the series, we will discuss pending listings, sale price to list price ratio, and price per square foot. Are there any other statistics that you look at when examining a market to gain a better understanding of it? Feel free to leave comments below. I would love to hear your take and possibly add something to my list of stats to consider in my own appraisal practice.
Pending Listings
Pending listings are listings that have accepted offers but have not yet closed. This statistic is crucial for understanding the current activity and momentum in the local real estate market. By analyzing pending listings, we gain valuable insight into the demand for properties in a specific area, allowing us to accurately gauge market sentiment and adjust pricing strategies accordingly. Pending listings serve as a leading indicator of future sales activity, providing valuable information for accurately pricing a listing by considering not just recent sales but also the current demand and competition in the market.
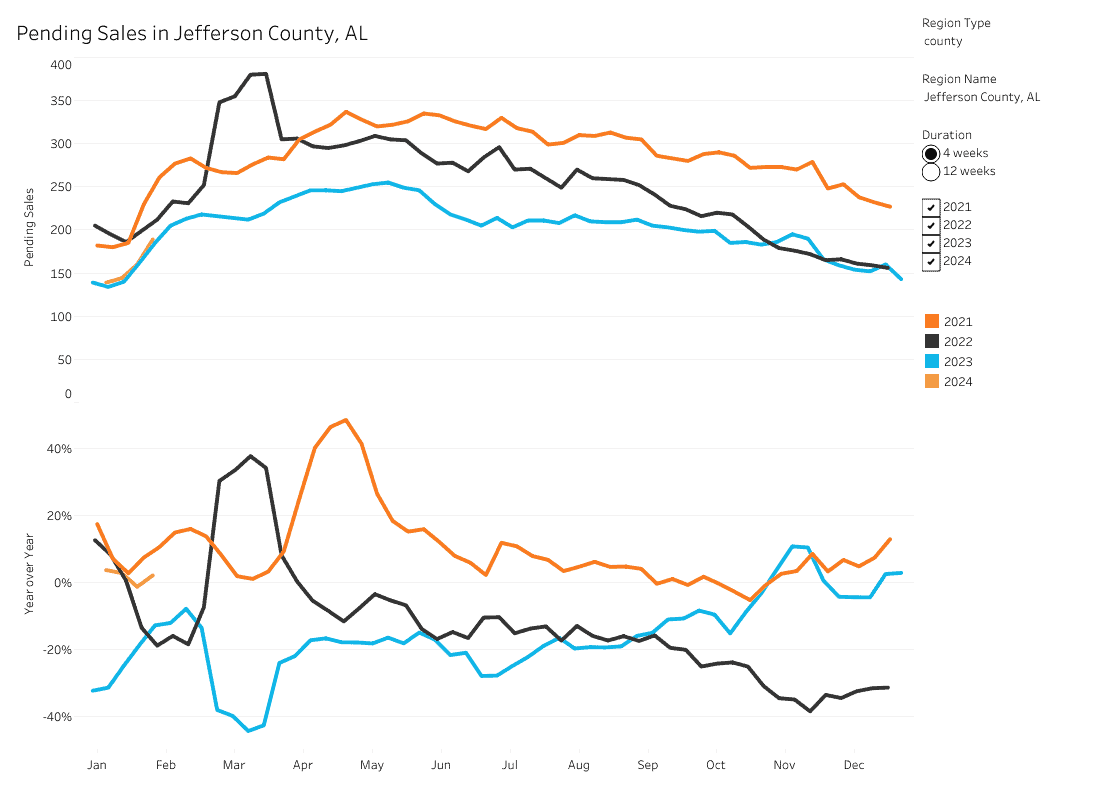
Pending listings give us a look at what future closed sales will be. An increase in pending sales is indicative of a market that is starting to pick up and be more active.
Appraisers can use pending sales in their appraisals, along with closed sales, and agents should also consider them. Of course, not all pending sales are the same.
A pending sale where the borrower is approved with financing and the property appraises for the contract amount and is just waiting to close is much better than one that just went under contract yesterday. The former example is pretty much a done deal whereas the latter example may or may not end up closing until the borrower has financing and the property appraises. The charts below have been provided by Redfin, a national real estate brokerage.
Click to enlarge

Click to enlarge
Pending sales in Jefferson County are tracking very closely to 2023, however, both years are down from 2021 and 2022. Shelby County has seen similar trends in 2023 and 2024 which is not a surprise given that they are both in the same general market area.
The upward trend is typical for this time of year as we approach Spring and Summer, then it will slowly decline until the end of the year. Of course, there will be some seasonality that occurs throughout the year as you can see in the chart.
Sale Price to List Price Ratio
The sale price to list price ratio signifies the relationship between the final selling price of a property and its initial listing price. Knowing this statistic helps us to understand buyer behavior in the real estate market.
By analyzing the sale price to list price ratio, we can learn about the level of negotiation happening between buyers and sellers, as well as the overall competitiveness of the market. This information helps us accurately price a listing by considering the typical discount or premium buyers are willing to pay relative to the initial listing price, ensuring that the pricing strategy aligns with market expectations and maximizes the likelihood of a successful sale.
We all know what happened after Covid with the competitiveness of the market. Many homes were selling over the list price because there were multiple offers due to the lack of inventory.
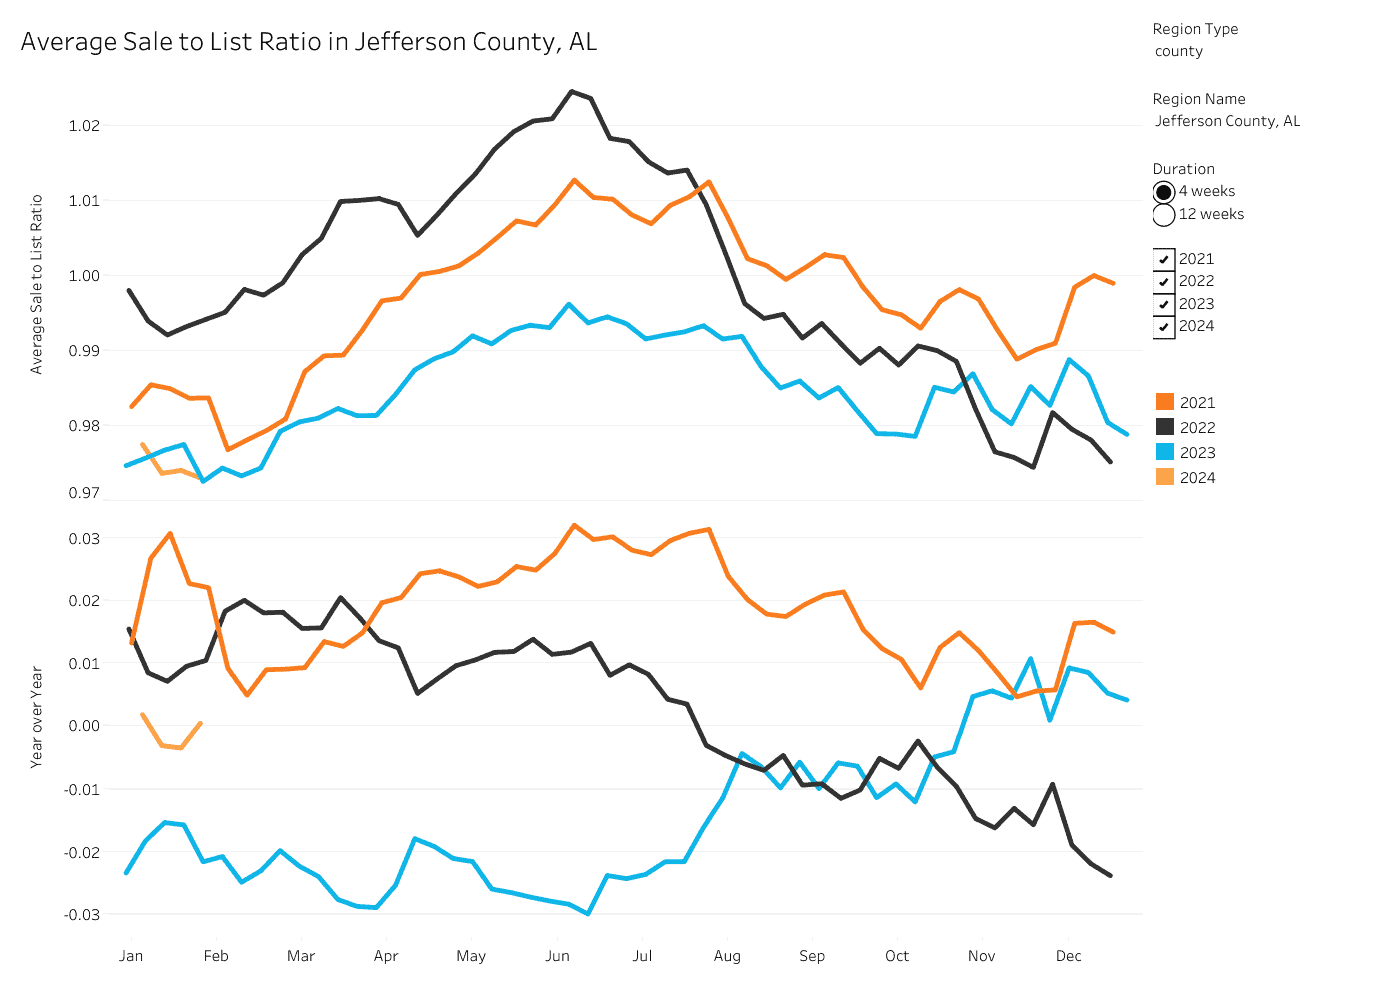
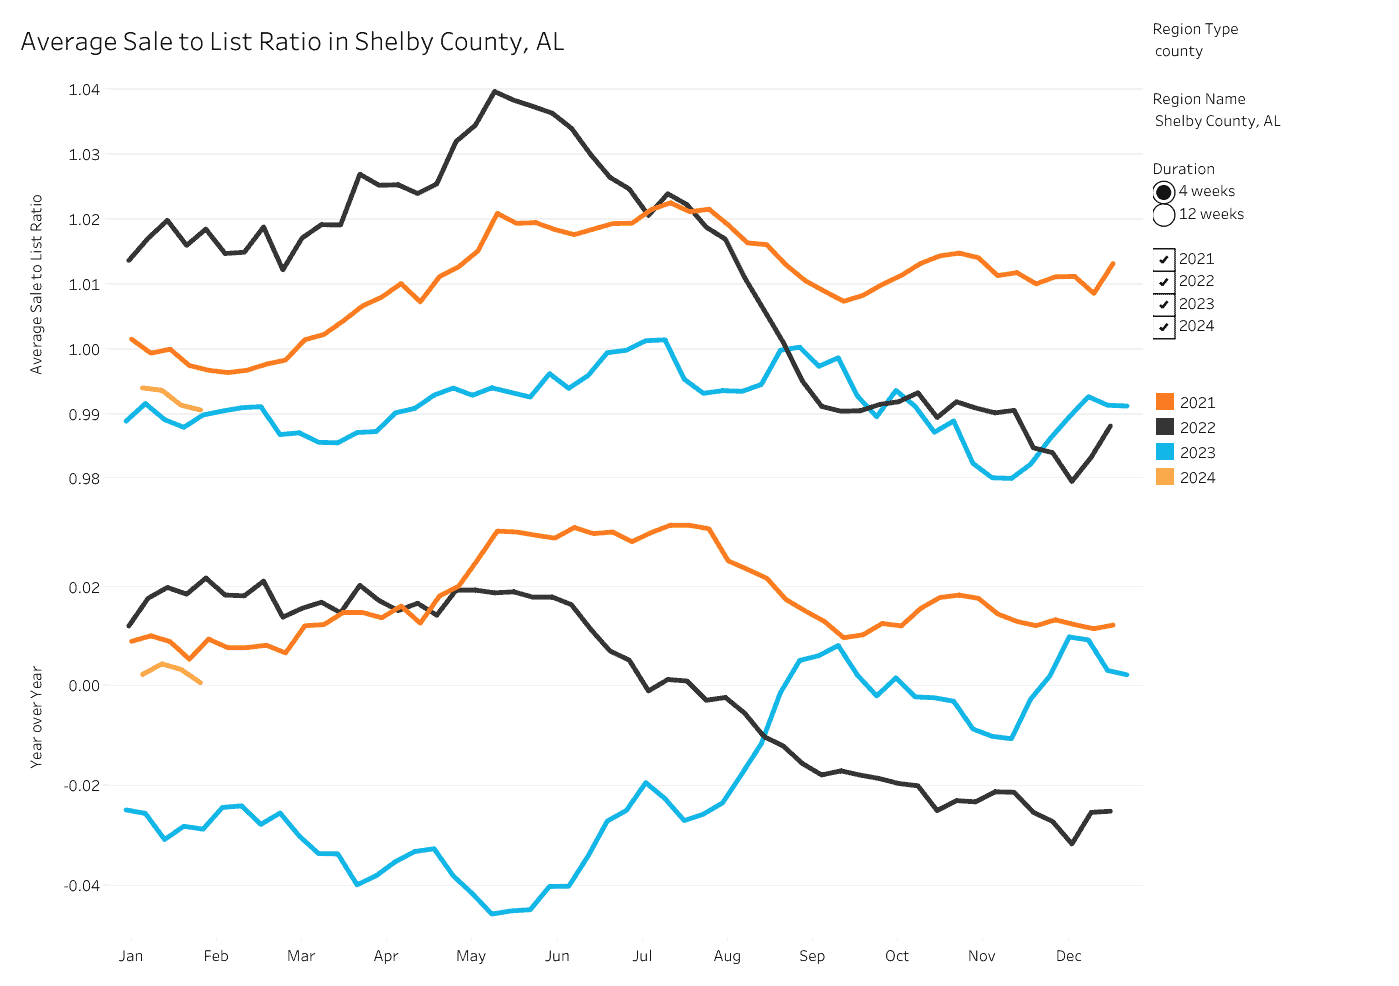
With the increase in mortgage interest rates in early 2022 many buyers that could not afford the higher payments left the market. Since then the sales price to list price ratio has returned to more normal levels due to less competition, however, this will depend on the specific area the house is located.
Click to enlarge
Click to enlarge
Like pending sales, the sales price to list price ratio so far in 2024 looks very similar to 2023. As you might expect it is also less than 2021 and 2022.
Price Per Square Foot
I’ve written before about price per square foot in my post titled “Price Per Square Foot is Not the Holy Grail of Property Value“. I believe too much emphasis can be placed on this well-known metric.
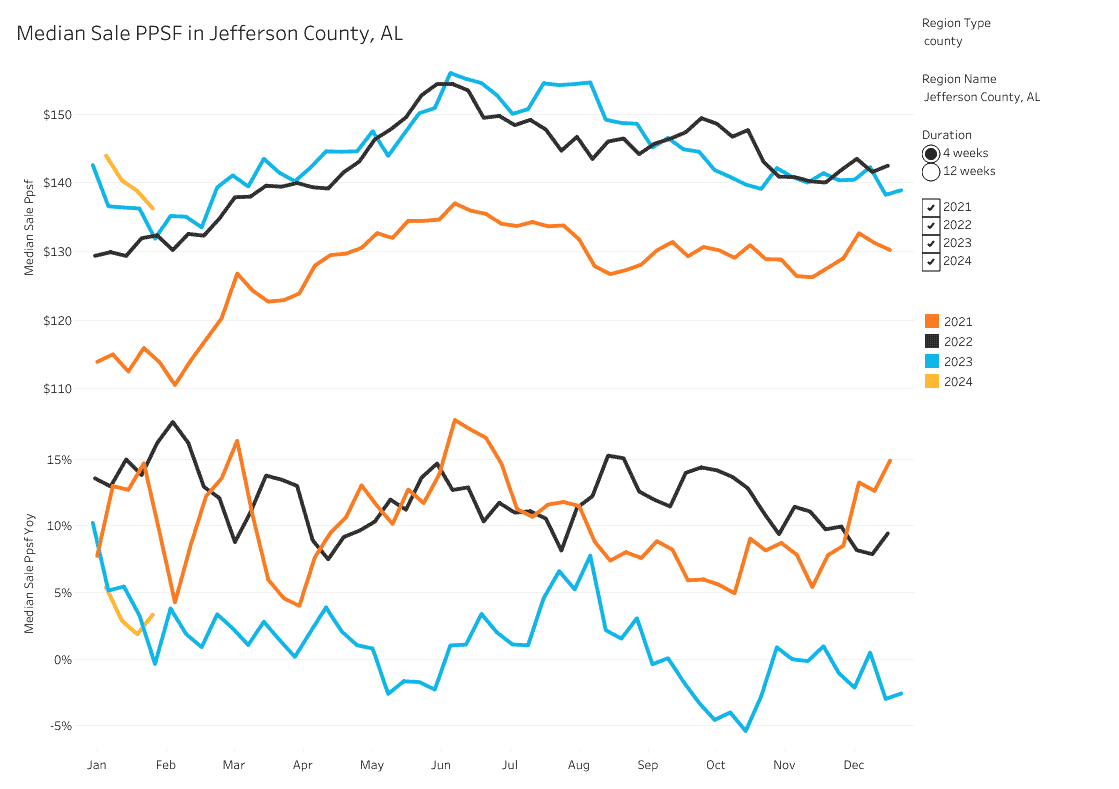
As I stated before, no single metric should be relied upon to describe a market, and price per square foot is no exception. This key statistic can vary wildly depending on the types of homes in the area. As you can see from the charts below, the price per square foot is at its highest over the past 4 years. This makes sense because the median price of homes has increased and these two stats are directly related.
Click to enlarge

Click to enlarge
If the homes in a neighborhood are very similar in style, quality, features, and condition then price per square foot can give you a decent indication of what properties are selling for per square foot, but this is rarely the case. Introduce variations to the features I just mentioned and the figure becomes almost irrelevant.
The price per square foot takes into consideration everything about the property so if a recent sale has a finished basement and pool, but your house does not, then you are not comparing apples to apples and the price per square foot of the sale tells you nothing about your property.
When looked at in aggregate over a large sample of properties it can provide us with helpful trend information, however, not much more. We can use the trend analysis, combined with the other stats we have discussed, to make educated assumptions about where the market is headed.
Conclusion
This is the last installment of my “Housing Statistics for Beginners” series and I hope it has been helpful. There are other statistics that are helpful to describe the market that I have not included. Please comment below with other key numbers that you look at. If you are an agent who utilizes statistical data in your home pricing analysis please comment and let everyone know how it helps you to do a better job in setting list prices. Thanks for being here and reading.
Good stuff, Tom. I find Redfin’s tool to be a helpful and quick resource. I also find the stats to be credible too as I compare them to the ones I pull. There are slight differences, but the trend is on point.
Thanks, Ryan. I have turned to Redfin and other similar websites to supplement my own local MLS. They seem to provide comprehensive and credible data.