Consumer prices continued to rise in March, with shelter and gasoline prices driving over half of the total increase. This marks the third consecutive strong reading. Despite a slowdown in the year-over-year increase, shelter costs continue to put upward pressure on inflation, accounting for over 60% of the total increase in all items excluding food and energy. This ongoing elevated inflation is likely to keep the Federal Reserve on hold and delay rate cuts this year.
The Fed’s ability to address rising housing costs is limited because increases are driven by a lack of affordable supply and increasing development costs. Additional housing supply is the primary solution to tame housing inflation. The Fed’s tools for promoting housing supply are constrained.
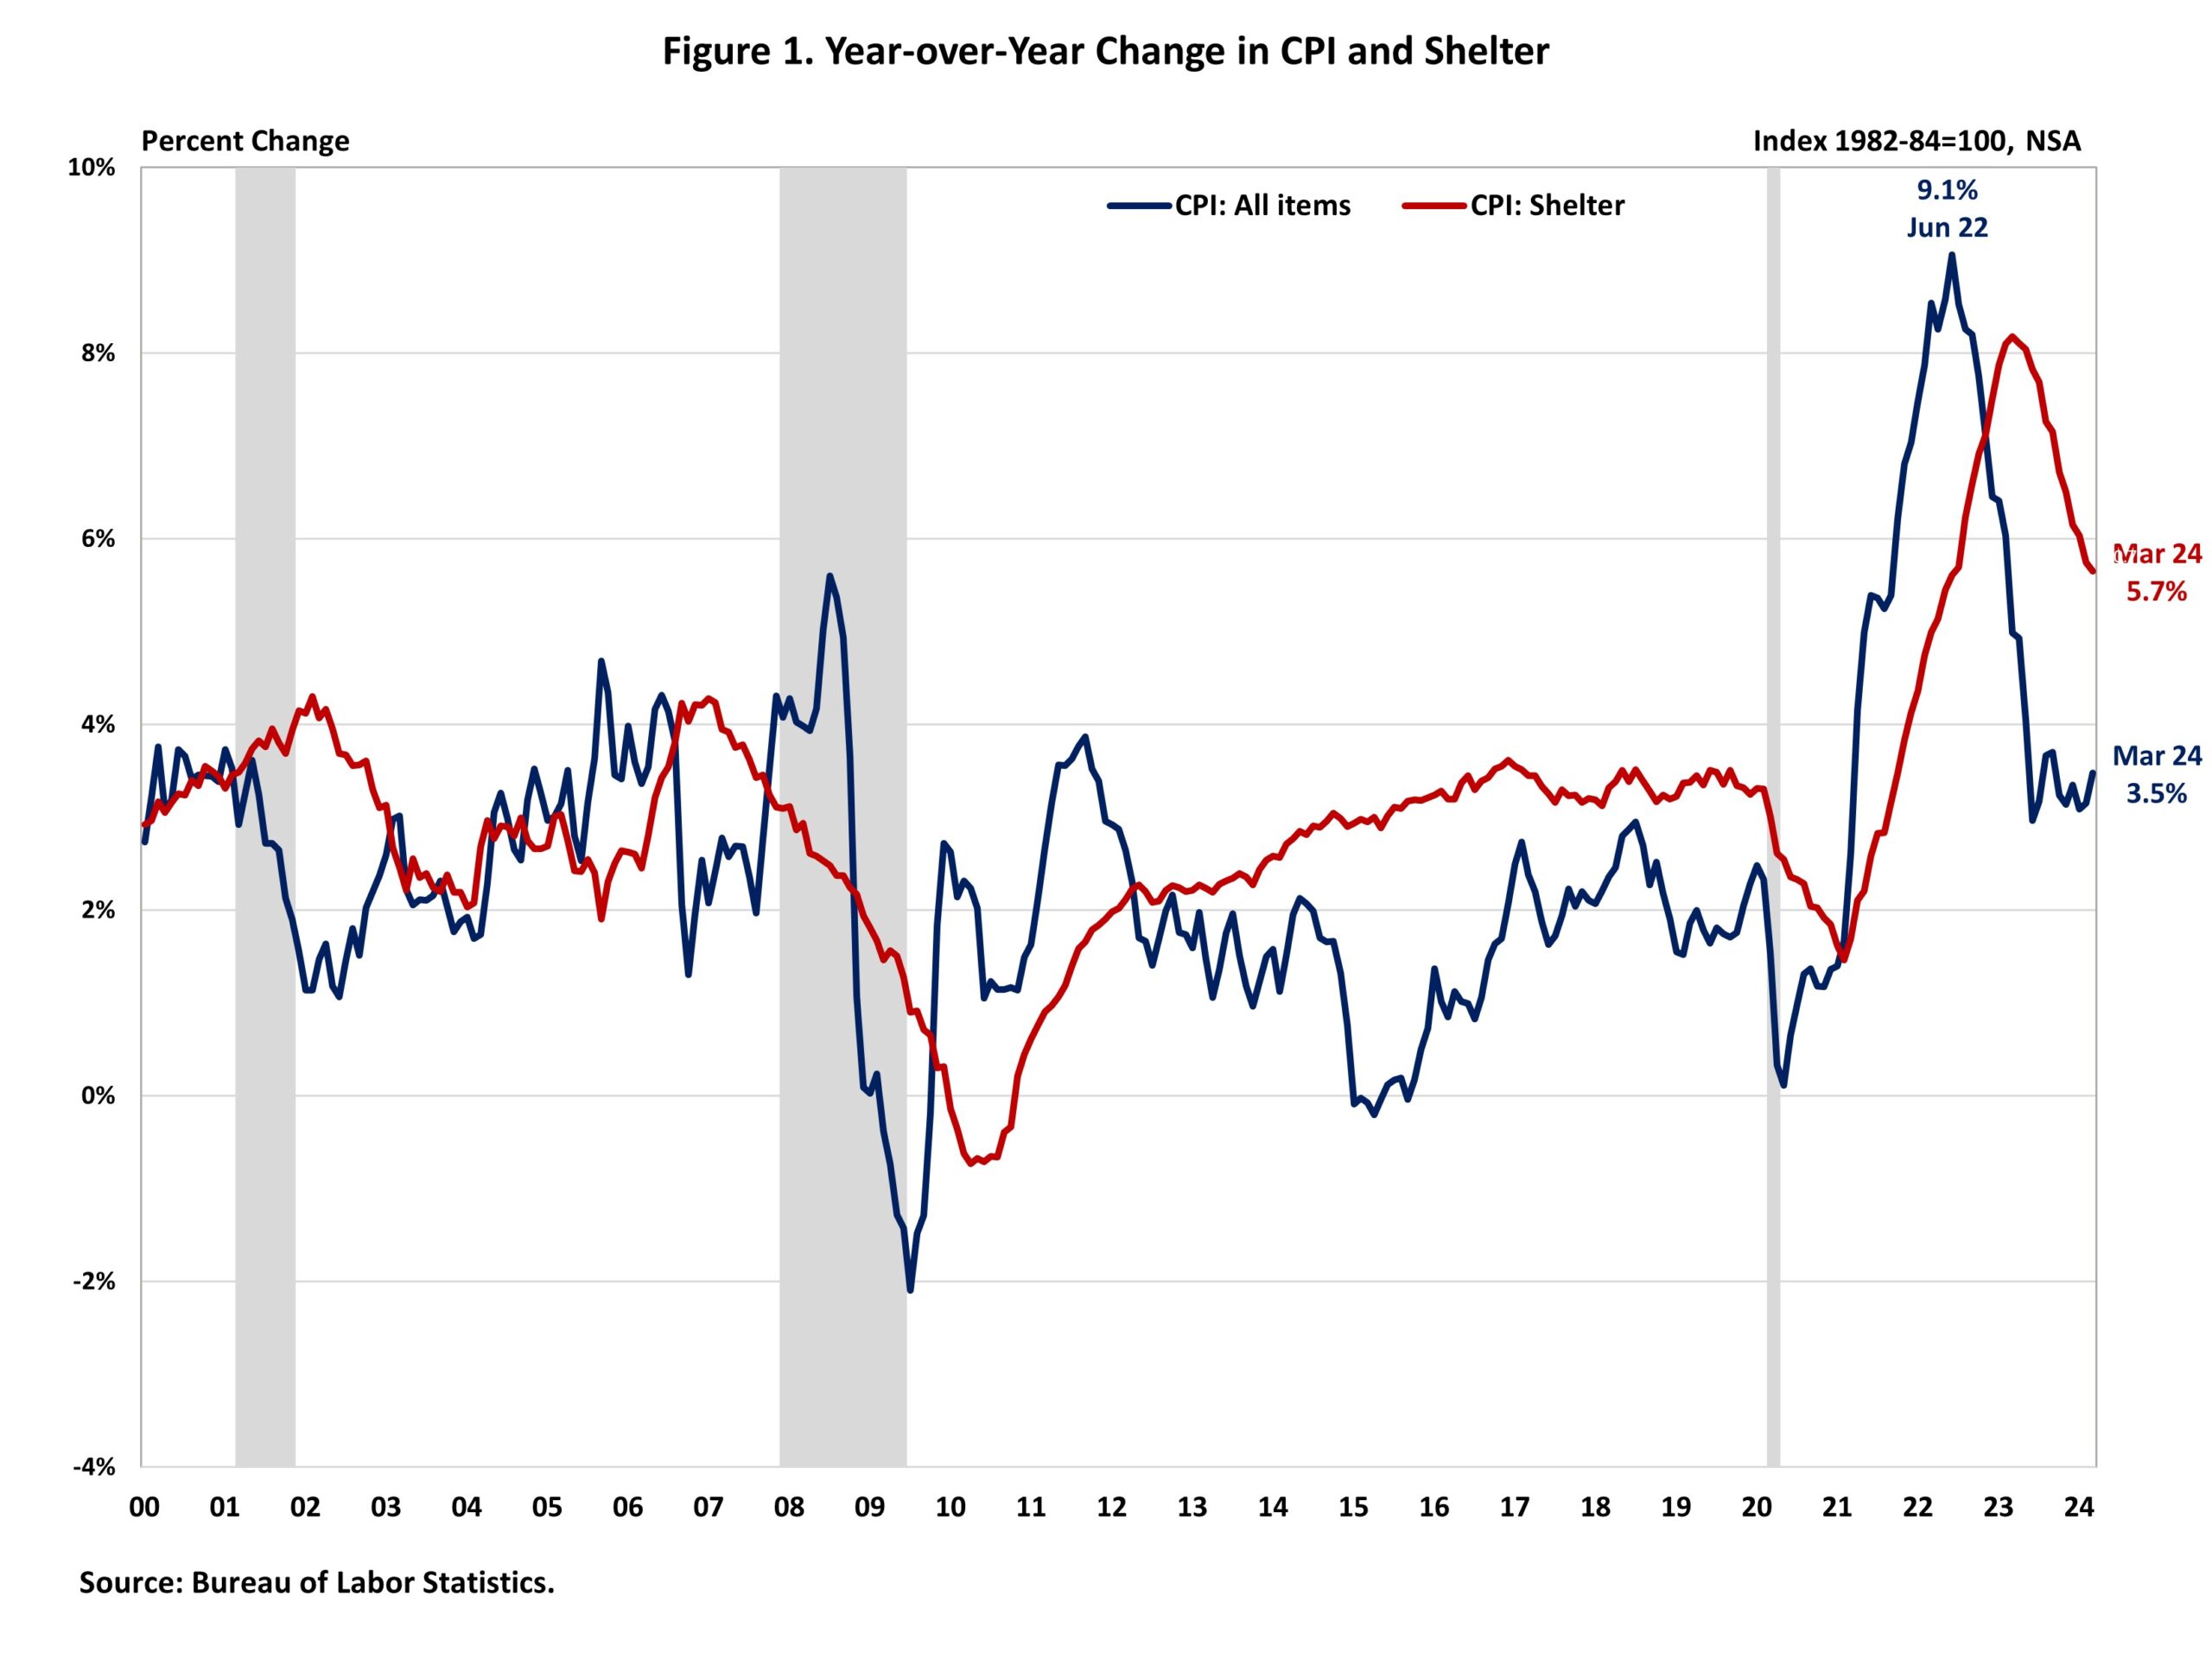
In fact, further tightening of monetary policy would hurt housing supply because it would increase the cost of AD&C financing. This can be seen on the graph below, as shelter costs continue to rise despite Fed policy tightening. Nonetheless, the NAHB forecast expects to see shelter costs decline further in the coming months. This is supported by real-time data from private data providers that indicate a cooling in rent growth.

With respect to the aggregate data, the Bureau of Labor Statistics (BLS) reported that the Consumer Price Index (CPI) rose by 0.4% in March on a seasonally adjusted basis, the same increase witnessed in February. The energy index rose by 1.1% in March as the increase in gasoline index (+1.7%) and electricity index (+0.9%) more than offset the decline in fuel oil index (-1.3%). Meanwhile, the food index increased by 0.1% in March with the food at home index remaining unchanged. Excluding the volatile food and energy components, the “core” CPI rose by 0.4% in March, mirroring the growth seen in the previous two months.
In March, the index for shelter (+0.4%) and gasoline (+1.7%) continued to be the largest contributors to the monthly rise in the overall CPI, accounting for over half of the increase. Among other top contributors that rose in March include indexes for motor vehicle insurance (+2.6%), medical care (+0.5%), and apparel (+0.7%). Meanwhile, the top contributors that experienced a decline in March include indexes for used cars and trucks (-1.1%), recreation (-0.1%), and new vehicles (-0.2%).
The index for shelter makes up more than 40% of the “core” CPI. The index saw a 0.4% rise in March and was the largest factor in the monthly increase in the index for all items less food and energy. Both the indexes for owners’ equivalent rent (OER) and rent of primary residence (RPR) increased by 0.4% over the month. These gains have been the largest contributors to headline inflation in recent months.

During the past twelve months, on a non-seasonally adjusted basis, the CPI rose by 3.5% in March, following a 3.2% increase in February. The “core” CPI increased by 3.8% over the past twelve months, as it did the previous two months. This was the slowest annual gain since May 2021. Over the past twelve months, the food index rose by 2.2%, and the energy index increased by 2.1%. This marks the first 12-month increase for the energy index since February 2023.
NAHB constructs a “real” rent index to indicate whether inflation in rents is faster or slower than overall inflation. It provides insight into the supply and demand conditions for rental housing. When inflation in rents is rising faster than overall inflation, the real rent index rises and vice versa. The real rent index is calculated by dividing the price index for rent by the core CPI (to exclude the volatile food and energy components). The Real Rent Index was unchanged in March.

Discover more from Eye On Housing
Subscribe to get the latest posts to your email.