
So far in 2024, fewer homes are taking price cuts than in 2023, and this trend is on the verge of breaking below the 2023 lows in price cuts percentages. While weekly inventory is still falling, we have year-over-year growth in total active listing and new listings data. This calls into question a mortgage rate lockdown, as mortgage rates are also higher year over year.
What is all this data pointing to? We might have an average year in housing compared to the past four years! So, we need to be very mindful of the weekly data to get clues on the marketplace.
Price-cut percentage
Every year, one-third of all homes take a price cut before selling — this is a traditional housing activity. However, this data can move stronger in either direction when mortgage rates rise or fall aggressively.
A perfect example was in 2022: when housing inventory rose faster as demand crashed, the percentage of price cuts rose faster. After November of 2022, home sales stopped crashing and the price-cut percentage data has stabilized. Even when mortgage rates were approaching 8% last year, the number of homes taking price cuts was always 4% below the 2022 level. Currently, the price-cut percentage is less than 1% from breaking below the lows set in 2023. Demand is rising from a low bar, and total housing inventory levels are still historically low. This is the price-cut percentage for last week over the last few years:
- 2024: 30.1%
- 2023: 32.2%
- 2022: 18.3 %
Weekly housing inventory data
A really positive story for 2024 is that we have higher housing inventory year over year. It isn’t anything to write home about, but it’s a positive story nonetheless. I am a very pro-housing supply person and will feel much better about the housing market when we return to pre-COVID-19 levels for total active listings. Last week, inventory fell week to week but was up over this time last year. I am still hoping we get the seasonal bottom in inventory in February and not March or April.
Here is a look at last week:
- Weekly inventory change (Feb. 2-9): Inventory fell from 497,389 to 494,862
- Same week last year (Feb. 3-10): Inventory fell from 457,717 to 444,129
- The recent inventory bottom was in 2022 at 240,194
- The inventory peak for 2023 was 569,898
- For context, active listings for this week in 2015 were 947,864
New listings data
The new listing data put a big smile on my face this week! For the first time in a while, this was a good week for new listing data. Over the last few years, we have been trending at the lowest levels ever, so seeing a positive week is great. Also, this brings into question the mortgage rate lockdown premise since mortgage rates are higher yearly. This is something I have been discussing for many months on CNBC.
Weekly new listing data for last week over the last several years:
- 2024: 51,875
- 2023: 44,533
- 2022: 45,594
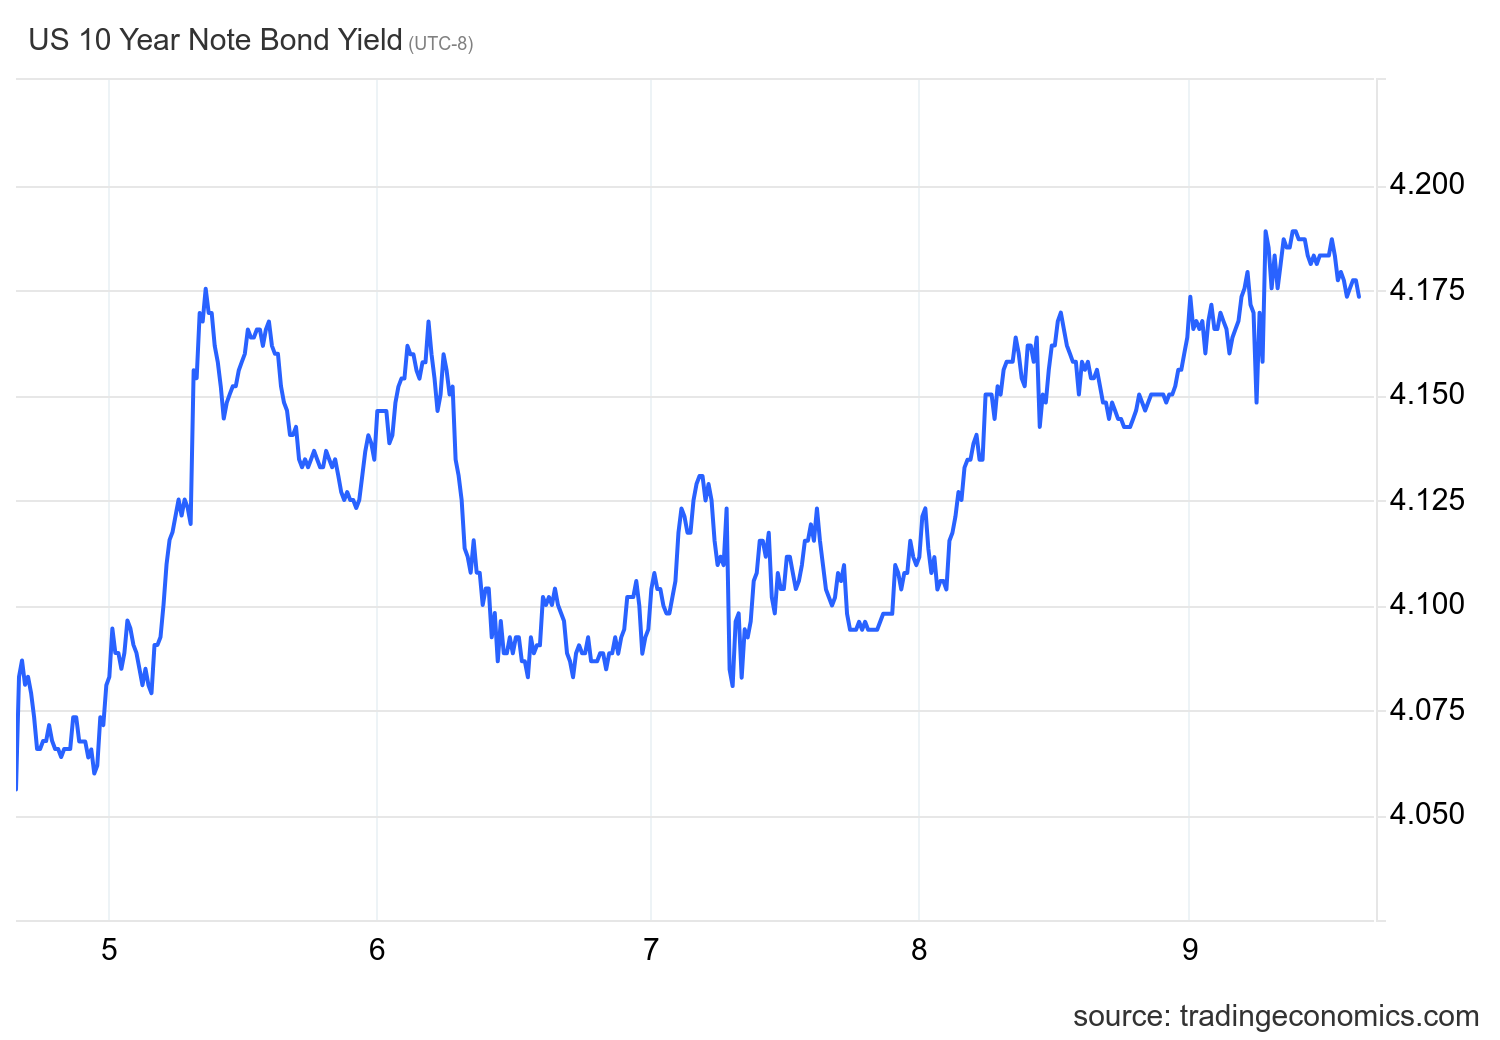
Mortgage rates and the 10-year yield
The 10-year yield is the key for housing in 2024. In my 2024 forecast, I put the 10-year yield range between 3.21%-4.25%, with a critical line in the sand at 3.37%. If the economic data stays firm, we shouldn’t break below 3.21%, but if the labor data gets weaker, that line in the sand — which I call the Gandalf line, as in “you shall not pass” — will be tested.
This 10-year yield range translates to mortgage rates between 5.75%-7.25%, but this assumes spreads are still bad. The spreads have been improving this year so much that if we hit 4.25% on the 10-year yield, we still won’t see 7.25% in mortgage rates.
Last week was very interesting because we had a few Fed events to deal with. First there was the aftermath of Jay Powell’s 60 Minutes interview. Then the president of the Minneapolis Fed, Neel Kashkari, made statements about how the Federal Reserve policy isn’t as tight as people would believe, presenting his case in this article. However, just a few days later, Kashkari talked about how his gut tells him that two to three rate cuts are indeed in play. I discussed this turn of events with Editor in Chief Sarah Wheeler on the HousingWire Daily podcast.
The 10-year yield closed at the week high on Friday, even though the highly anticipated CPI revisions data showed that the inflation slowdown was accurate and no upward revisions were made.
Mortgage rates didn’t move around too much last week, ranging between 7.04% and 6.95%. However, as we can see, even with significant progress on the growth rate of inflation slowing down, mortgage rates are near 7% and the 10-year yield is still over 4%. My point on this topic has been clear for a while: the Fed hasn’t pivoted, and they have a highly restrictive policy against housing as they still believe in their COVID-19 housing policy keeping home sales trending near all-time lows.
Purchase application data
Last week, we had some confusion on purchase apps, as the unadjusted numbers showed 6% week-to-week growth. We don’t account for that data line ever; the actual numbers showed -1% week-to-week growth, and we are still showing negative 19% year-over-year data. Last year, we had better positive data as mortgage rates headed down toward 6% before rates started higher, so the year-over-year comps will get easier. However, if we had strong housing demand, purchase application data would easily be positive year over year and by double digits as well. For now, just think of a bounce from record lows in demand.
The year-to-date count is two positive reports and two negative purchase application reports. Since mortgage rates started to fall in November of 2023, we have had eight positive and two negative weeks after making some holiday adjustments. This has the potential to take the seasonal inventory bottom to March. However, I am hoping for the bottom in February.
The week ahead: It’s inflation week, plus retail sales and housing starts
We have a lot of data coming up: two inflation reports, retail sales, the builder’s confidence index and housing starts. The CPI inflation data will be exciting over the next six to seven months because we can start to see the rent factor kicking into higher gear to the downside. Even though the Fed says they don’t account for shelter when talking about rate cuts, lower inflation will bring more and more pressure on them to pivot and bring rates down. We will have tons of data lines to work from next week.

