What is the best news for mortgage rates long-term? It’s getting more supply of apartments! The best way to fight inflation is always by adding more supply; if your goal is to destroy inflation by killing demand, that is only a temporary fix.
Housing inflation post-2020 was one for the record books, not only because home prices accelerated in such a short time, but more importantly for the inflation data, rents took off, something that didn’t happen during the housing bubble years.
The government accounts for housing inflation by looking at rents, not home prices. The chart below is the CPI Shelter Index, and as you can see during the crazy years of the housing bubble, rent inflation was very tame compared to what we see in the data recently.
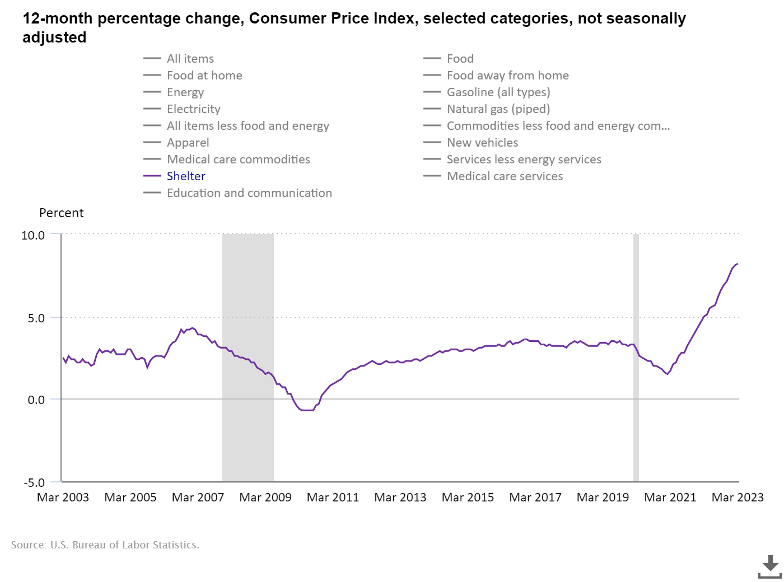
Since 44.4% of the Consumer Price Index is shelter inflation, it’s a massive deal in economics that rents took off in the last two years. Without rents taking off, the CPI data would look much more tame, like what we saw from the years 2000-2019.
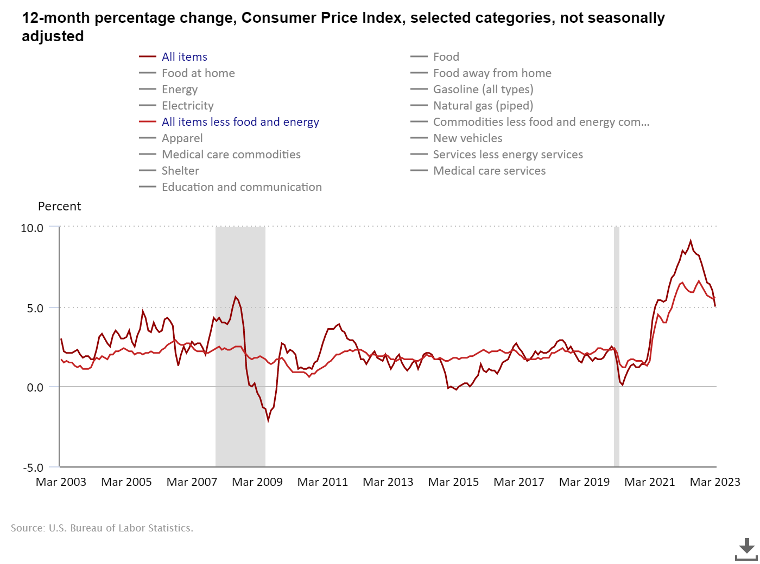
As you can see in the chart below, core CPI wasn’t exploding at all this century until COVID-19 hit us. More supply of apartments coming on line will be good news for mortgage rates going forward. The history of global pandemics has always been inflationary early on, as the production of goods gets hit immediately. Then things tend to cool down over time from their inflationary peak level.
Over the next 12 months, the CPI data will account for the real-time cooling down of shelter inflation. And just like the data lagged early on when shelter inflation took off; the opposite will happen over the next year.
Tuesday’s housing starts data does show some promise on the front of attacking inflation and helping lowering mortgage rates, so let’s look at the report and find out what I am talking about.
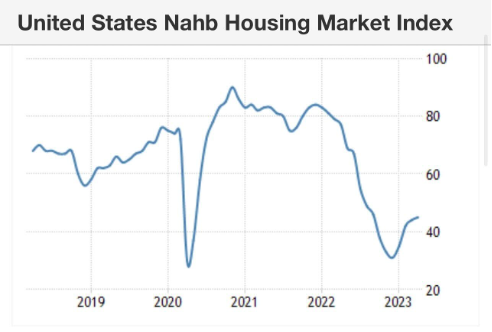
First, however, remember that the housing market is still in a recession, which I wrote about on June 16, 2022. Housing permits have been falling as the builders simply have too much supply to be confident in building homes again. The housing market is still in a recession until housing permits rise in duration. Even though the builder’s confidence index has been rising recently, it still hasn’t led to a significant uptick in housing permits.
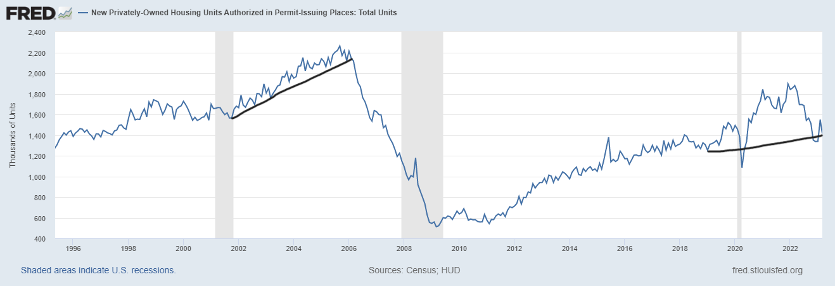
From Census: Building Permits Privately‐owned housing units authorized by building permits in March were at a seasonally adjusted annual rate of 1,413,000. This is 8.8 percent below the revised February rate of 1,550,000 and is 24.8 percent below the March 2022 rate of 1,879,000. Single‐family authorizations in March were at a rate of 818,000; this is 4.1 percent above the revised February figure of 786,000. Authorizations of units in buildings with five units or more were at a rate of 543,000 in March.
As you can see in the chart below, this looks nothing like the housing peak in 2005 and the crash toward 2008. Back then, housing permits were collapsing as new home sales fell 82% from the peak. Currently, new home sales have been trending better as the builders are taking advantage of low existing inventory. Of course, once we get lower mortgage rates, that should help the builders sell more homes.
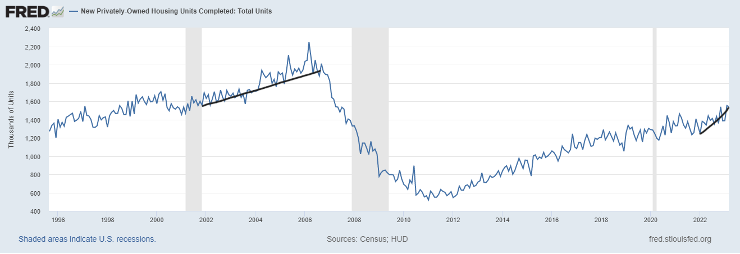
The big difference in this housing recession versus other cycles is that housing completions are still rising, which is unusual. However, because of the COVID-19 delays, we are still working through a backlog of homes under construction.
From Census: Housing Completions Privately‐owned housing completions in March were at a seasonally adjusted annual rate of 1,542,000. This is 0.6 percent (±13.3 percent)* below the revised February estimate of 1,552,000, but is 12.9 percent (±18.6 percent)* above the March 2022 rate of 1,366,000. Single‐family housing completions in March were at a rate of 1,050,000; this is 2.4 percent (±12.4 percent)* above the revised February rate of 1,025,000. The March rate for units in buildings with five units or more was 484,000.
As you can see below, completions are like a slow-moving turtle, but they are still rising, so while housing permits are falling, consistent with the housing recession, housing completions are a different story.
Now the data line that excites me the most, of course, is shelter inflation, meaning the growth rate of rent inflation, because it’s cooling down already. This is something I talked about on CNBC last September on the day the CPI report was being reported.
As shelter inflation and wage growth cool down, we are adding more supply, not subtracting. This is key for mortgage rates looking out for years to come. As you can see in the chart below, we have a historic number of 5-unit construction in the works. This is the best way to fight inflation — with supply, with more choices, and landlords having to compete with more supply, preventing them from raising rents faster. The goal should be getting these units out as fast as possible.
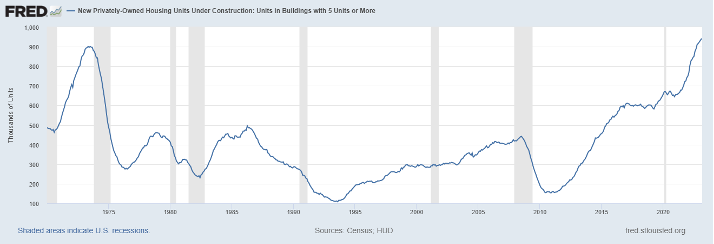
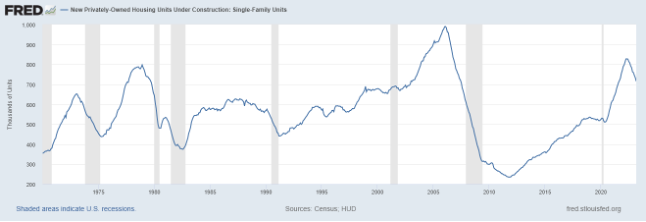
One thing that will likely happen soon is that 5-unit builds under construction will start falling, such as we see with single-family homes under construction. With the Federal Reserve wanting a job-loss recession and banking credit getting tighter, apartment construction should fall like it did in the recession of 1974. I just hope it doesn’t collapse down like it did in the recession of 1974. As we can see in the chart below, the single-family units under construction are already falling as they should.
While the housing starts data doesn’t look like too much is happening and still has a recessionary vibe, we have some positive data in these reports.
As the cost to borrowers rises and credit gets tighter, we should be grateful that we have many apartments under construction. Just imagine if rental inflation wasn’t cooling down in real time, and we didn’t have these apartments in the works — it would look like the 1970s again.
That is the last thing the housing market and the U.S. economy need, rent inflation taking off as it did in the mid and late 1970s. This would mean mortgage rates have room to go higher and stay higher.
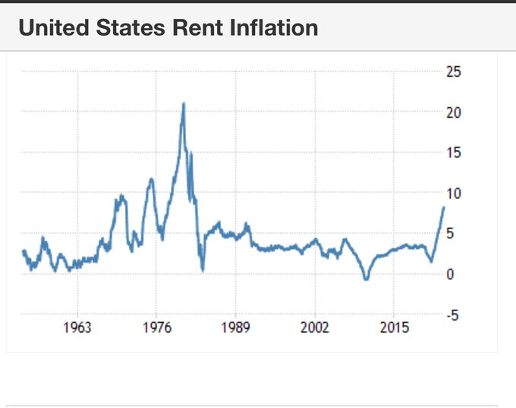
As you can see in the chart above, after the burst in housing inflation coming from the 1970s, things started to calm down. You can also see why and how inflation wasn’t a problem this century until COVID-19 hit us. That is the history of global pandemics, inflation data gets wild as supply chains are broken, and then things get back to normal over time.