
Mortgage rates had a chance to break to new highs this year, but the Federal Reserve took a moderate tone at the last Fed meeting. We saw the benefit of lower mortgage rates with the last two existing home sales reports, which showed growth. Then mortgage rates rose, facilitating five weeks of negative purchase application data.
As rates were hitting year-to-date highs, the fear was that the Fed would go hawkish in their March meeting, which could push mortgage rates toward 8% and tank 2024 demand. Thankfully, that didn’t happen, and — as I said on the HousingWire Daily podcast last week —we dodged a bullet.
Let’s look at the tracker data to see how mortgage rates are impacting the housing data as we settle into spring.
10-year yield and mortgage rate talk
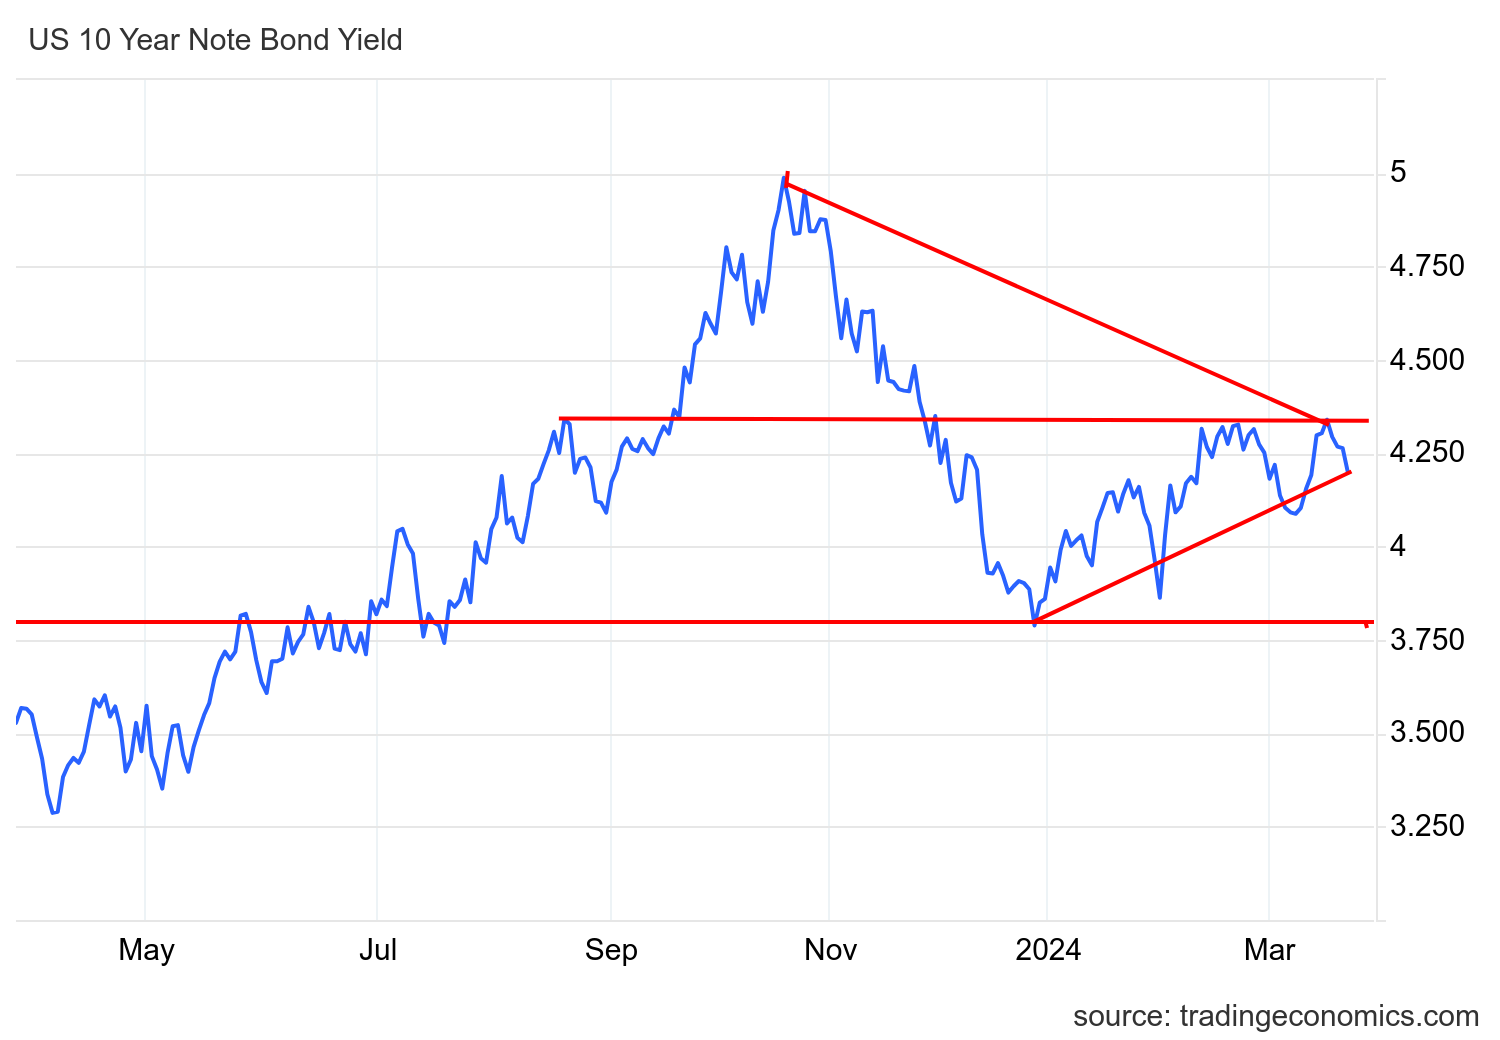
For those of you who have followed me for the last 12 months, you know how important the 4.34% level on the 10-year yield is for my economic work. A break of this level could send mortgage rates toward 7.5%-8% for spring 2024. Not only did this not happen last week, but bond yields fell during the week. As we can see below, we have held the line once again, but we aren’t out of the dark forest yet.
As we can see in the chart below, the 10-year yield and mortgage rates have made a massive move higher since 2022. However, whenever the 10-year yield falls with duration, as we saw toward the end of 2022 and into 2023, it sends mortgage rates lower, and we can grow sales from these record-low levels.
Purchase application data
Purchase application data really moves on mortgage rates — something we saw in late 2022 and into 2023. As rates ticked up recently, purchase apps were down 1% week to week and down 14% year over year.
Since November 2023, we have had 10 positive and six negative purchase application prints after making holiday adjustments. Year to date, we have had four positive prints versus six negative prints. What have 2022, 2023, and 2024 shown us? When mortgage rates fall, demand picks up. Imagine a housing market with just 6% mortgage rates or lower — it would be growing like what we see in the new home sales market.
Weekly housing inventory dataThe best housing story for 2024 so far is that inventory is growing yearly. The growth isn’t just in active inventory but also new listings. We’re not seeing seller stress in the inventory data but just a typical increase in inventory when rates are higher, which looks perfectly normal.
Here is a look at the inventory last week:
- Weekly inventory change (March 15-22): Inventory rose from 507,160 to 512,759
- The same week last year (March 16-23): Inventory fell from 414,967 to 413,883
- The all-time inventory bottom was in 2022 at 240,194
- The inventory peak for 2023 was 569,898
- For some context, active listings for this week in 2015 were 985,141
New listings data
New listing data is growing! This data line is slightly lower than I hoped for for 2024, but we are still growing. Right now we are a tad below the levels we saw in 2022 before mortgage rates spiked over 6%. Here’s the weekly new listing data for last week over several previous years:
- 2024: 60,328
- 2023: 49,933
- 2022: 61,862
For some historical context, in 2011, new listings this week were at 362,339 .
Price-cut percentageEvery year, one-third of all homes take a price cut before selling — this is regular housing activity and this data line is very seasonal. The price-cut percentage can grow when mortgage rates move higher and demand gets hit. When rates fall, they go lower than an average year.
Keep it simple here, folks: inventory is growing year over year; if demand stays weaker with higher rates, the price-cut percentage data should increase faster, and if demand picks up with lower rates, it shouldn’t. As we can see below, the data line is very seasonal, like most housing data.
- 2024: 31.4%
- 2023: 30.4%
- 2022: 17%
The week ahead: Housing and inflation data
Next week, we have new home sales, pending home sales and the national home price index data. I will be on CNBC Monday morning to discuss the new home sales report. Of course, the Fed’s main inflation indicator, the PCE, will come out on Friday, which is a trading holiday, which will be key for rates short-term until we have the next Fed meeting. So, we have a lot of data to work with this week.

