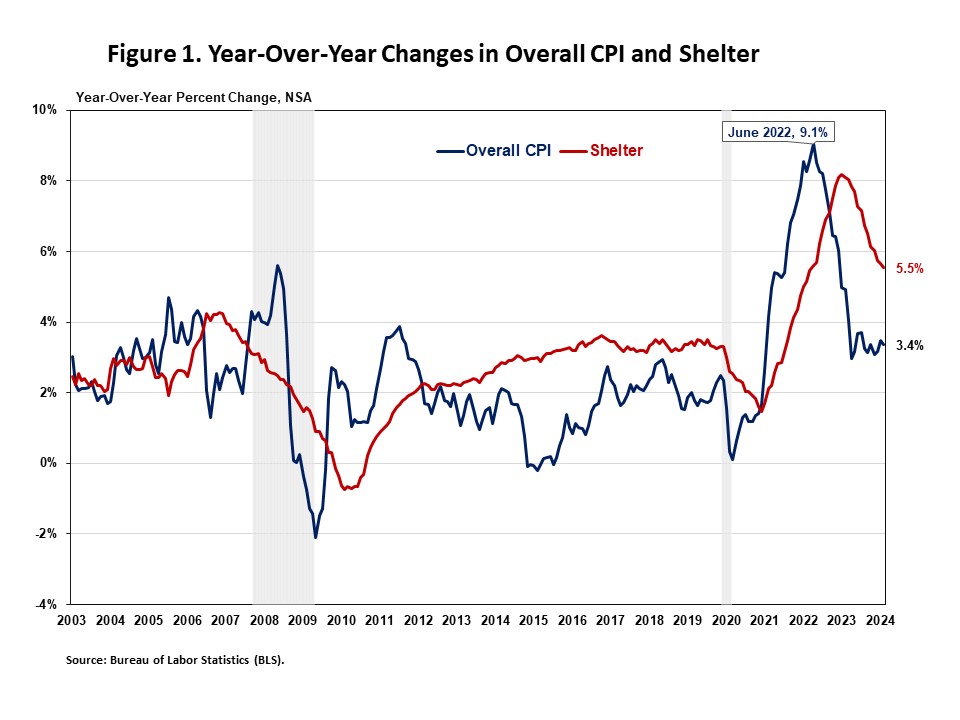
Both overall and core inflation eased slightly in April amid higher costs for gasoline and shelter. On a year-over-year (YOY) basis, the shelter index rose by 5.5% in April, following a 5.7% increase in March. Despite a slowdown in the YOY increase, shelter costs continue to put upward pressure on inflation, accounting for nearly 70% of the total increase in all items excluding food and energy. This ongoing elevated and uneven inflation is likely to keep the Federal Reserve on hold and delay rate cuts this year.
The Fed’s ability to address rising housing costs is limited because increases are driven by a lack of affordable supply and increasing development costs. Additional housing supply is the primary solution to tame housing inflation. The Fed’s tools for promoting housing supply are also constrained.
In fact, continued tightening of monetary policy would hurt housing supply because it would increase the cost of AD&C financing. This can be seen on the graph below, as shelter costs continue to rise despite Fed policy tightening. Nonetheless, the NAHB forecast expects to see shelter costs decline further in the coming months. This is supported by real-time data from private data providers that indicate a cooling in rent growth.
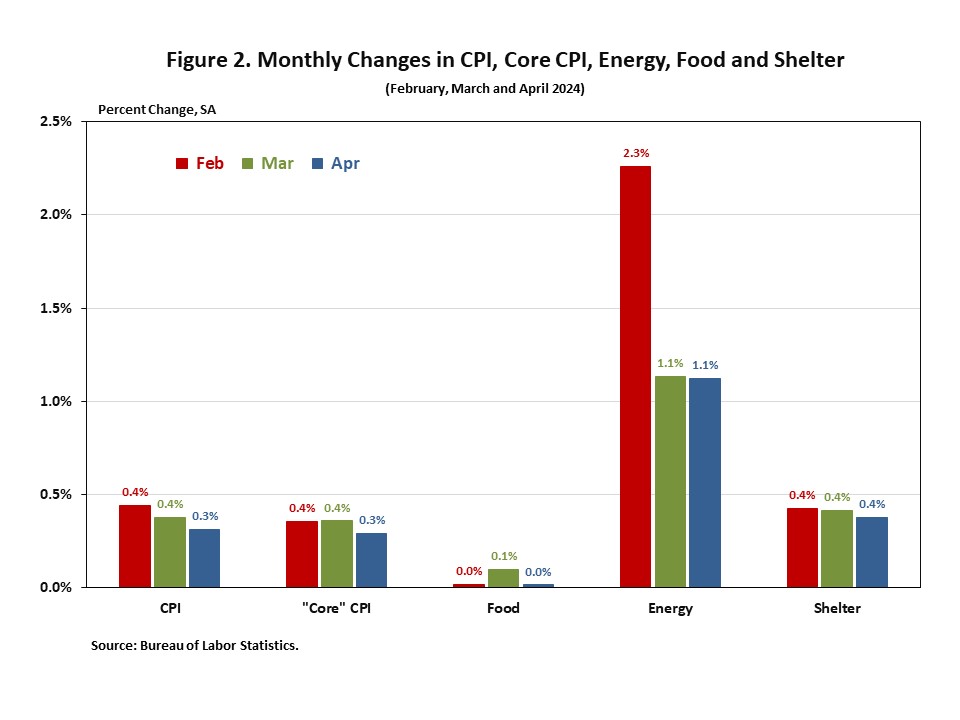
The Bureau of Labor Statistics (BLS) reported that the Consumer Price Index (CPI) rose by 0.3% in April on a seasonally adjusted (SA) basis, after an increase of 0.4% in March. It marks the largest monthly increase since June 2009. Excluding the volatile food and energy components, “core” CPI increased by 0.3% in April, after three consecutive months of 0.4% increases.
The price index for a broad set of energy sources rose by 1.1% in April, as gasoline prices increased by 2.8%. While energy commodities increased by 2.7%, energy services declined by 0.7%. The food index was unchanged in April, after a 0.1% increase in March. The index for food away from home rose 0.3%, and the index for food at home decreased by 0.2% in April.
The shelter index rose by 0.4% for the third straight month and remained the largest factor in the monthly increase in the index for all items less food and energy. Both the indexes for owners’ equivalent rent (OER) and rent of primary residence (RPR) increased by 0.4% over the month. These gains have been the largest contributors to headline inflation in recent months.
The indexes for shelter and gasoline together contributed over 70% of the monthly increase in the index for all items.
During the past twelve months, on a non-seasonally adjusted (NSA) basis, the CPI rose by 3.4% in April, following a 3.5% increase in March. The “core” CPI increased by 3.6% over the past twelve months, slower than a 3.8% increase in March. It marks the lowest YOY gain since April 2021. Over the past twelve months, the food index rose by 2.2% for the third straight month, while the energy index increased by 2.6%.
NAHB constructs a “real” rent index to indicate whether inflation in rents is faster or slower than overall inflation. It provides insight into the supply and demand conditions for rental housing. When inflation in rents is rising faster (slower) than overall inflation, the real rent index rises (declines). The real rent index is calculated by dividing the price index for rent by the core CPI (to exclude the volatile food and energy components).
In April, the Real Rent Index rose by 0.1%, after being unchanged in March. Over the first four months of 2024, the monthly growth rate of the Real Rent Index was 0%, on average, slower than the average of 0.2% in 2023.

Discover more from Eye On Housing
Subscribe to get the latest posts to your email.