This is an excerpt of a HousingWire Research report titled: What Everyone Needs to Know about Mortgage Rate Lock-in, by Altos President Mike Simonsen.
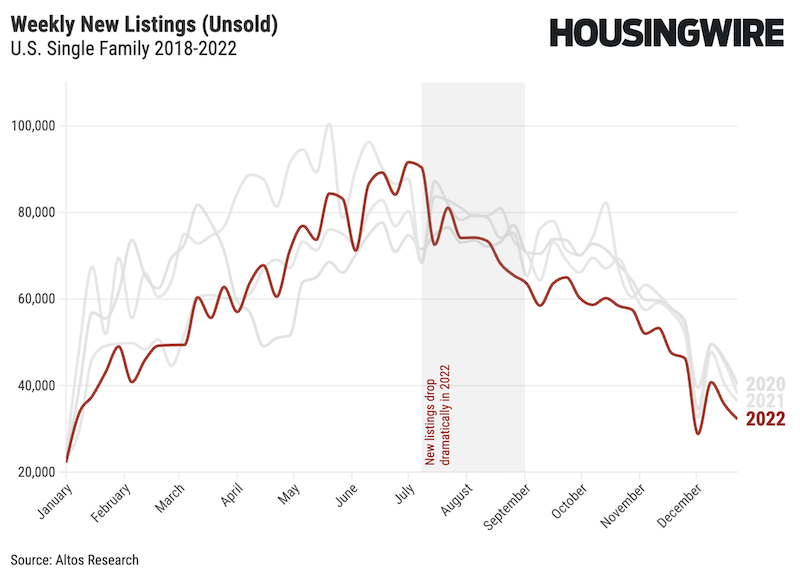
In the 24 months beginning March 2022, the U.S. housing market saw dramatic changes in affordability as mortgage rates skyrocketed 500 basis points. After an initial rush to get to market in Q2 2022, new listings volume fell precipitously. In July 2022, new listings volume per week dropped from 90,000 at the end of June to approximately 74,000 just after the July 4th holiday. That’s a swing of 17% fewer sellers in just a matter of days.
The National Association of Realtors, via its Seasonally Adjusted Annual Rate of Existing Home Sales series, reported that the peak home sales volume of 6.6 million in January 2021 (when mortgage rates were 2.7%) fell to 3.9 million by October of 2023 (when rates crossed over 8%).
FHFA, in its March 2024 research paper, The Lock-In Effect of Rising Mortgage Rates, quantified the degree to which rising mortgage rates slowed housing purchases in 2023. Researchers developed a framework for estimating the number of home sales in 2024 based on the current levels for mortgage rates. They concluded that the net effect of rapidly rising mortgage rates led to 1.3 million fewer home sales between March 2022 and December 2023. A homeowner with a 4% mortgage is 50% less likely to sell their home when rates are at 7% than if prevailing rates were still at 4%.
The authors used a novel approach to determining if a home didn’t sell. They compared fixed-rate mortgages to adjustable-rate mortgages. Homeowners with adjustable-rate mortgages aren’t subject to lock-in because their rates are adjusted. What’s not measured in the FHFA paper is how by 2023, seller volume had already been declining for nearly a decade.
By Q1 2015, more than 60% of American homeowners with mortgages had rates locked in under 5%. By Q1 2022, 80% of mortgage holders were locked in with their incredibly cheap financing. In that period, we can see seller volume decreasing as more and more Americans had mortgages under 5%.
In other words, it’s not just the difference between the prevailing mortgage rate and the rate you hold, it’s actually just having a really great deal. It’s simple: When money is very cheap, we want to own real estate. The lower rates go, the fewer home sellers we have.
We can observe this trend in both the count of new listings per week and in the total number of unsold homes on the market. Available inventory of homes to buy follows a reliable seasonal trend with the low in Q1 and the high in Q3 of each year (except for the 2020 pandemic year).
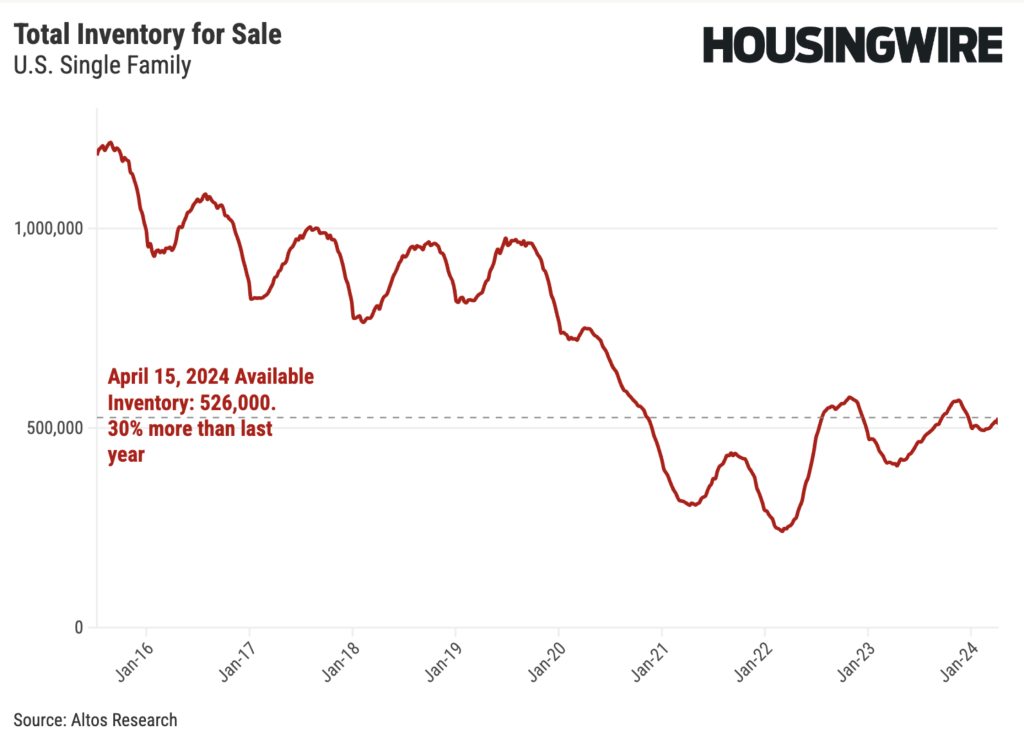
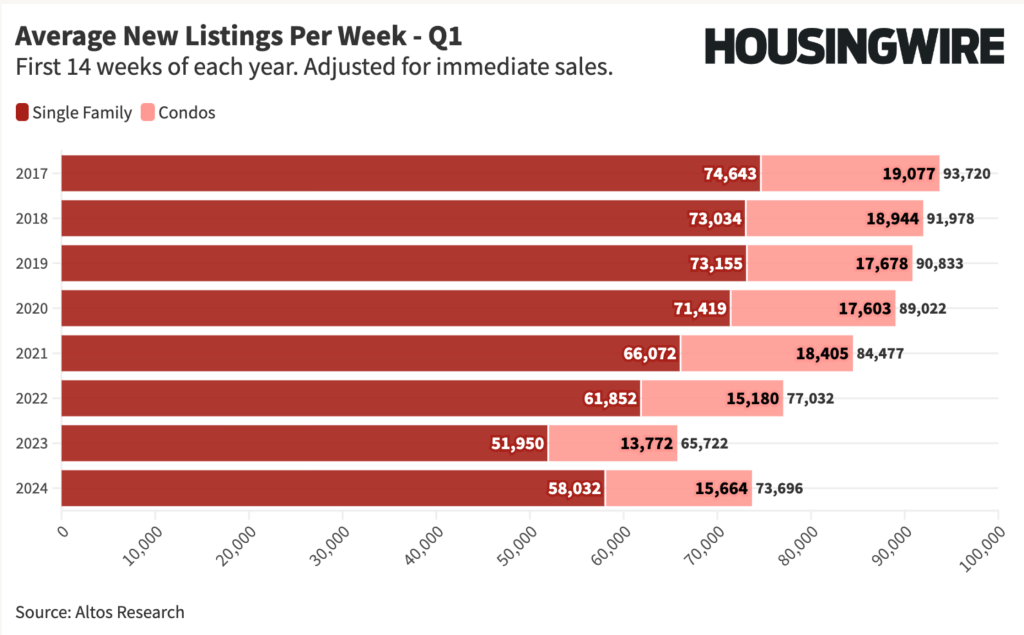
Notice each year’s peak and trough show fewer homes than the previous year. We include details of inventory changes and the relationship to interest rates in the sections below. We see the same pattern in the new listings rate each week. Throughout most of the last decade, fewer sellers entered the market each year. We’ve illustrated that shrinking market trend below by showing the average number of new listings in the first 14 weeks of each year.
In 2020 and 2021, home sales dramatically accelerated with plummeting mortgage rates. By watching the unsold inventory data, we can observe that demand accelerated more than supply at this time. It could be argued that home sales would have been greater if more homes were available to be purchased: we call this a supply-constrained market. Part of the home sales slowdown in 2023 was due to a lack of inventory. This was a supply-constrained market.
In 2024, as inventory increases, we can see the rate of sales increasing as well. This is despite the fact that mortgage rates are still climbing.
This is why using inventory as a measure of lock-in is more useful than sales, because sales are not an adequate measure of demand in a supply-constrained market. In most of the years of the last decade, demand for homes exceeded the available supply, keeping a lid on sales and pushing home prices to new levels of unaffordability. The lock-in didn’t start in 2022 when rates rose. We assert that the lock-in started in 2014 when rates started falling and homeowners grew ever more reluctant to sell.
Download the entire report here.