
What’s going on with housing inventory? The last four weeks of new listings data have been the most volatile since mortgage rates breached 6% in 2022. One week, we had the biggest decline in new listings data all year, which might indicate Americans are giving up on listing their homes. But the next week we had the biggest increase of the year, which might show that people are rushing to list their homes.
In reality, the volatility in housing inventory is due to the Labor Day holiday, the start of school and the fact that new listings are trending at the lowest levels ever.
Weekly housing inventory
Some of the volatility with new listings data has also hit the active listings data. Two weeks ago, active listings grew by 343; this week, active listings grew by 9,470. The average of the two weeks is 4,906. As I have stressed, weakness in demand can lead to inventory growth over time, it’s just that in 2023, the growth is much slower than what we saw in 2022. My happy zone for active listings growth is between 11,000-17,000 weekly but this year inventory growth has just been too slow.
According to Altos Research:
- Weekly inventory change: (Sept. 1-Sept. 8): Inventory rose from 509,156 to 518,626
- Same week last year (Sept. 2-Sept. 9): Inventory rose from 547,222 to 552,042
- The inventory bottom for 2022 was 240,194
- The inventory peak for 2023 so far is 518,626
- For context, active listings for this week in 2015 were 1,201,196
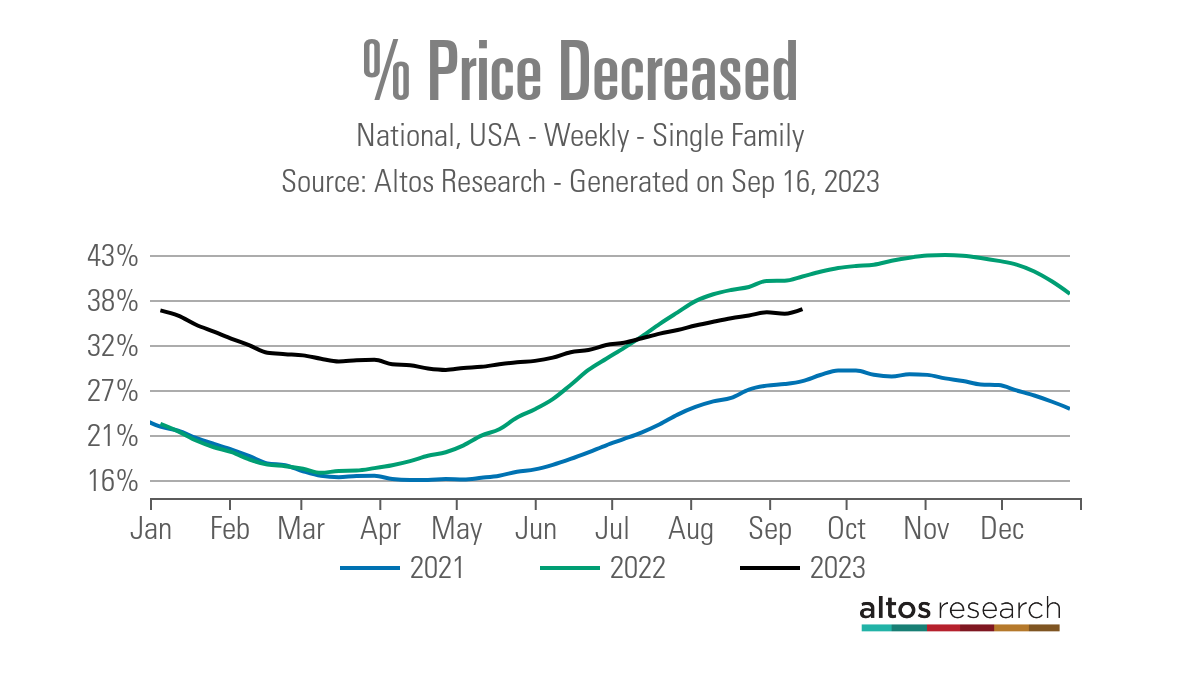
One of the data lines I will incorporate weekly going forward is the price cut percentage. Historically, one-third of all homes have price cuts year-round. For last week, price cuts are lower than last year by 4%. However, the housing market still has affordability issues and we are seeing higher price cuts than in 2015-2017. Back then, we were running at 33%; while in 2018 and 2019, it was 36%.
- 2021 28%
- 2022 41%
- 2023 37%
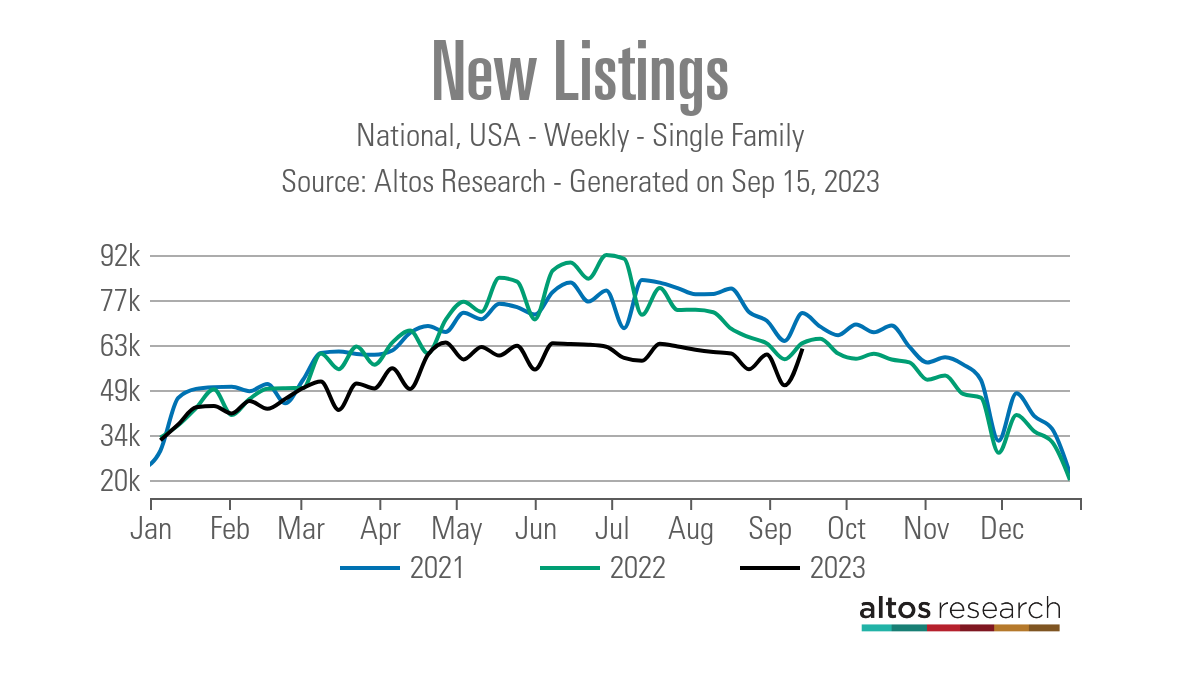
New listing data should be calmer now
As we have discussed, the data has been extreme lately — you can see it in the weekly data below. Now that we have gotten past Labor Day and the start of school, we can keep an eye on whether we have a new trend up or down in the new listings data. I had been anticipating some flat-to-positive year-over-year data in new listings this year in the second half of the year. However, we haven’t gotten that data just yet.
- Aug. 18: 60,295
- Aug. 25: 55,291
- Sept. 1: 60,004
- Sept. 8: 50,212
- Sept. 15: 61,852
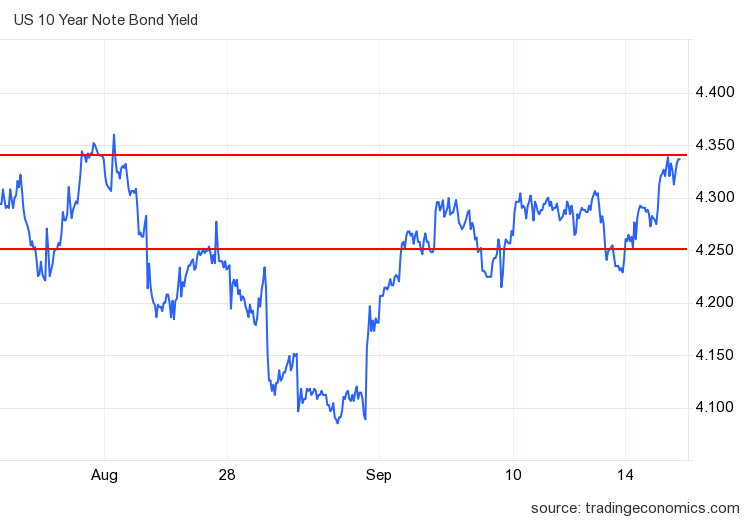
Mortgage rates and the bond market
Mortgage Rates rose slightly from 7.22% to 7.29% last week, but we are having an epic battle on the 10-year yield. A few weeks ago, after the 10-year yield closed above my peak forecast level of 4.25%, my only attention was on the 4.34% level — which was the intraday high in 2022.
So far, since that time, the 10-year yield has attempted to break over this level several times and it’s been rejected every time. It is critical to stay below 4.34% because if that level breaks, we can see more bond market selling and higher mortgage rates. However, sticking with my 2023 forecast, we are at the peak levels of 2023, so I believe the upside in higher yields is limited unless the economy outperforms.
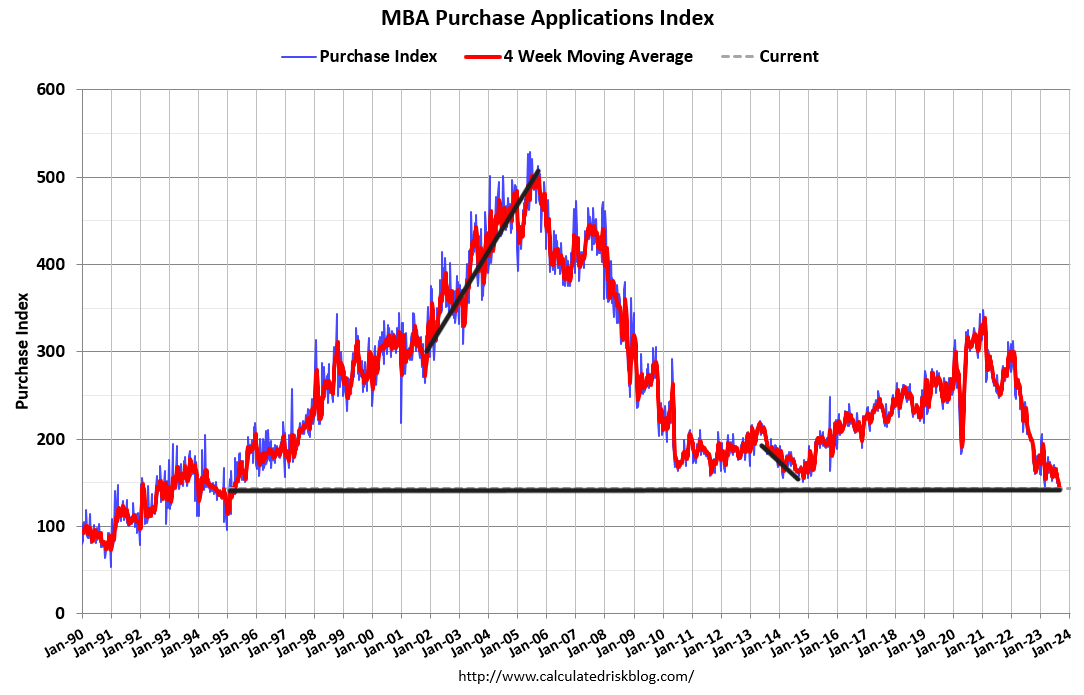
Purchase application data
Purchase application data was 1% higher last week, making the year-to-date count 16 positive, 18 negative prints and one flat week. If we start from Nov. 9, 2022, it’s been 23 positive prints versus 18 negative prints and one flat week.
Higher rates have slowed demand and sent purchase apps back to 1995 levels. When mortgage rates fell from 7.37% back down to 5.99% late last year, we had three months of solid positive growth, but after that, rates were too high to promote growth in this data line. Since rates have been above 7%, the data has gotten slower. While home sales aren’t crashing like last year, they’re not growing either.
The week ahead: Housing reports on the docket
Coming up this week we have the builder’s confidence data — which has been slipping lately — housing starts and the existing home sales report. The Leading Economic Index is also coming out this week and has been in a recessionary downtrend for a long time. On Monday’s HousingWire Daily podcast, I will be outlining how close we are to a recession, and what to look for over the next 12 months.

