
The slow rise of housing inventory this year has made the existing home sales market savagely unhealthy again. However, last week was good; we had less inventory growth than I would like to see, but it’s better than the past few weeks. Mortgage rates rose again and purchase apps saw a mild decline week to week.
- Weekly active listings rose by 8,815
- Mortgage rates rose from 6.89% to 7% before ending the week at 6.98%
- Purchase apps were down 1% from week to week
Weekly housing inventory
It has been a disappointing spring and summer for housing inventory in 2023, with active listings turning negative year over year. But last week did see some growth in active listings, even though it’s less than I was hoping for. Can we keep this up before the seasonal decline of active listings?
- Weekly inventory change (July 14-July 21): Inventory rose from 470,458 to 479,273
- Same week last year (July 15-July 22): Inventory rose from 508,633 to 525,548
- The inventory bottom for 2022 was 240,194
- The inventory peak for 2023 so far is 479,273
- For context, active listings for this week in 2015 were 1,202,909
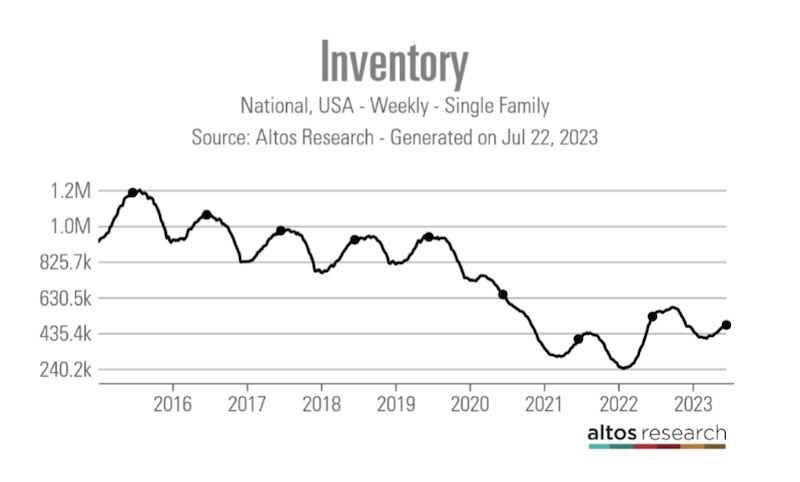
As you can see below, the slope of the housing inventory curve from the seasonal bottom on April 14 has been slow enough that active listings have turned negative year over year. However, last year was very abnormal: We had the biggest one-year sales crash ever, working from the lowest active listings data in March 2022.
New listings had a good week, considering how the year has gone, which is a plus as this data line was down five straight weeks. We have been trending at the lowest levels recorded in U.S. history for 12 months and now we’re heading toward the seasonal decline period. The one positive thing about new listing data is that even with mortgage rates near or above 7% for two months, we haven’t seen a noticeable drop recently.
New listings by year:

- 2023: 63,313
- 2022: 81,053
- 2021: 82,774

The 10-year yield and mortgage rates
Bond yields and mortgage rates rose last week, to 7% again, as labor data was solid. As I have stressed all year: for 2023, it’s all about jobless claims. Those looked good last week, so bond yields and mortgage rates headed higher after the news broke Thursday morning.
In my 2023 forecast, I said that if the economy stays firm, the 10-year yield range should be between 3.21% and 4.25%, equating to mortgage rates between 5.75% and 7.25%. I believe the only way we get below 3.21% on the 10-year yield is for the labor market to break, and that would require jobless claims to get over 323,000 on the four-week moving average, which hasn’t happened.
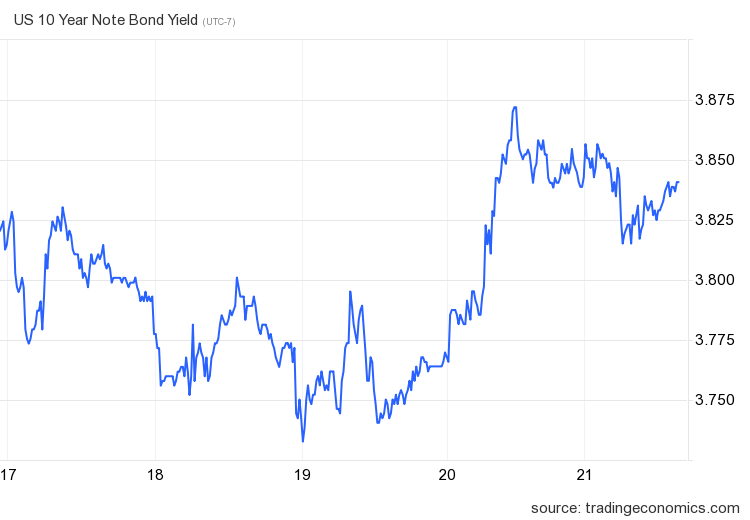
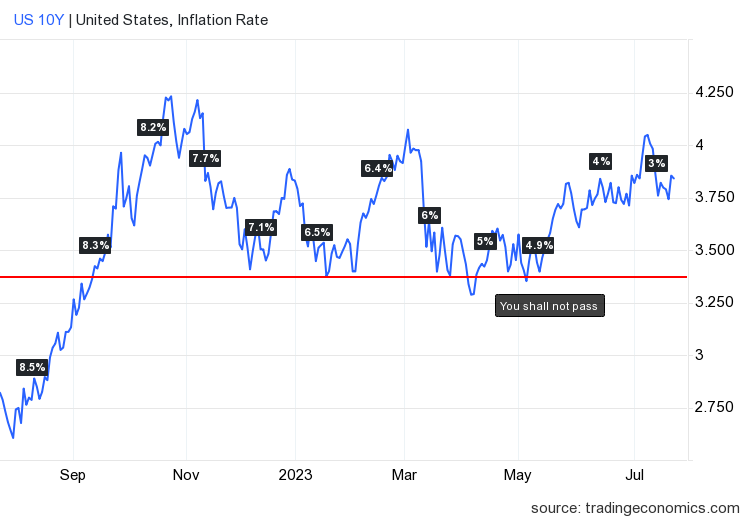
So far this year, my 10-year yield channel has been correct 100%. The growth rate of inflation falling is very important for housing and the U.S. economy, but for 2023 I put more weight into the labor market data.
Of course, after the banking crisis happened this year, spreads between the 10-year yield and mortgage have gotten worse. They have improved a bit recently, but if it weren’t for this year’s banking crisis, mortgage rates would be lower than they are, so that’s a shame.
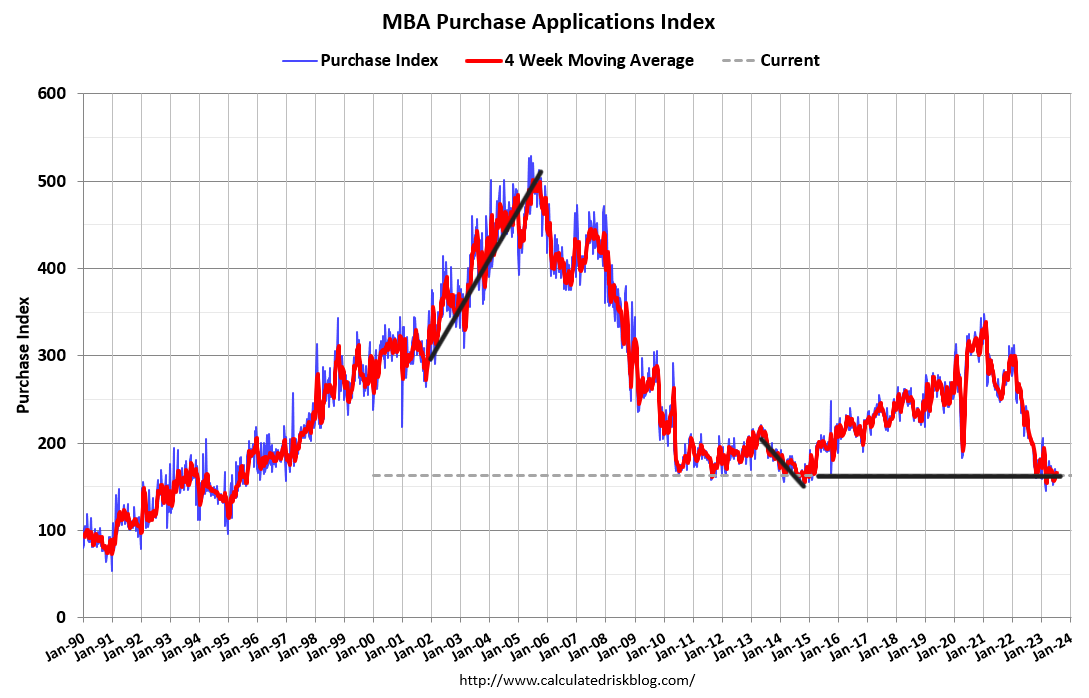
Purchase application data
Purchase application data was down 1% weekly, making the count for the year-to-date data 14 positive and 13 negative prints. If we start from Nov. 9, 2022, it’s been 21 positive prints versus 13 negative prints. The recent push higher in mortgage rates hasn’t created the downfall in this data line like it did last year. However, it’s been hard to get much growth either in demand, so it’s been a standoff for sure in 2023.
Last week we got the existing home sales report, which I wrote about here. We can see that we haven’t been able to grow sales after the big existing home sales print we got in February.

The week ahead will be wild
We have a lot going on this week. We have the Fed meeting, of course, and the market expects the Fed to hike rates and will look for hints of one more rate hike in the pipeline unless data doesn’t warrant it.
We also have a ton of housing news coming up, including FHFA House Price Index and the S&P CoreLogic Case-Shiller Home Price Indices. We’ll get new home sales this week, and pending home sales, where the demand isn’t as strong as new home sales. We also have the PCE inflation report on Friday, so this is a huge week for the bond market and mortgage rates as well. Buckle up, folks and stay tuned for more coverage.


For some wild speculation. If the courts rule that Sellers no longer have to pay for buyer’s agents, that may put a damper on demand as buyers may have to pay for the their representation or go it alone. That should be a game changer.