The slow zombie crawl of housing inventory went lower last week as inventory was negative week to week. In addition, mortgage rates rose to a yearly high as labor data stayed firm and purchase apps had their first negative week after three straight weeks of positive growth.
- Weekly Active listings fell by 866 homes
- Mortgage rates rose to a year-to-date high of 7.22%
- Purchase apps were down 5% week to week
Weekly housing inventory
We had a hat trick in housing last week: weekly active listings were negative week to week, new listings were negative week to week, and active listing + new listing data is negative year over year. This is truly a savagely unhealthy housing market as we have too many people chasing too few homes.
The weekly active listing data had a rare week-to-week decline. Part of this can be attributed to the July 4th holiday, but the trends this year versus last year have been so different that it’s not 100% based on a holiday week.
- Weekly inventory change (June 30-July 7): Inventory fell from 465,755 to 464,889
- Same week last year (July 1-July 8): Inventory rose from 472,046 to 487,319
- The inventory bottom for 2022 was 240,194
- The inventory peak for 2023 so far is 472,688
- For context, active listings for this week in 2015 were 1,197,641
The housing inventory growth is so slow this year that the active listings data today in July isn’t even higher than our January levels, which is typically when we see the seasonal bottom for the year’s first half. As we can see in the chart below, it’s been so slow that year-over-year inventory is now negative versus 2022.
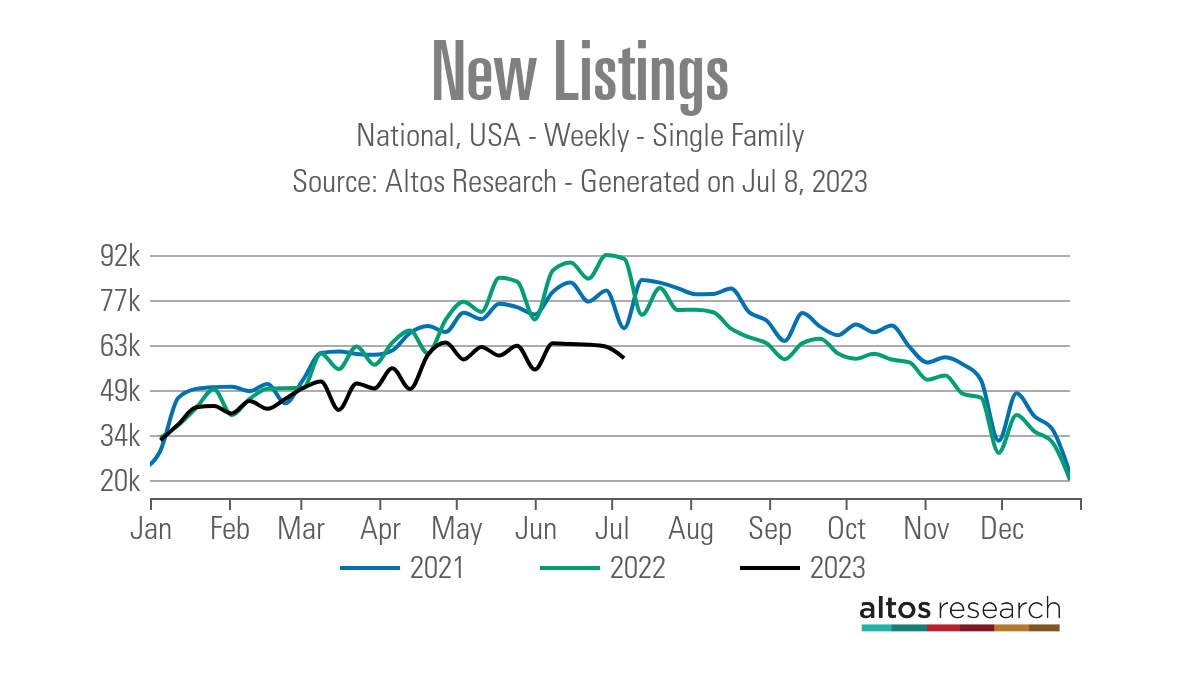
The other big story in housing has been that new listing data has been trending at the lowest levels recorded in history for 12 months. We have had four straight weeks of declines and we are about to run into the seasonal decline in this data line. As we can see below, there is a big difference between 2023 data for this week versus 2022 data.


- 2023: 58,813
- 2022: 90,336
- 2021: 68,328
The 10-year yield and mortgage rates
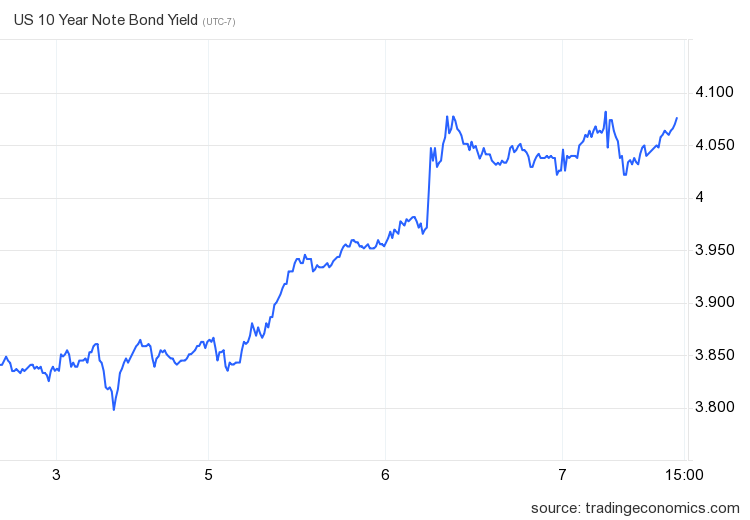
Mortgage rates started the week at 7.03% and ended at 7.14%. The 10-year yield is close to yearly highs as the U.S. bond market doesn’t see a job-loss recession happening soon. As you can see below, bond yields rose noticeably during jobs week.
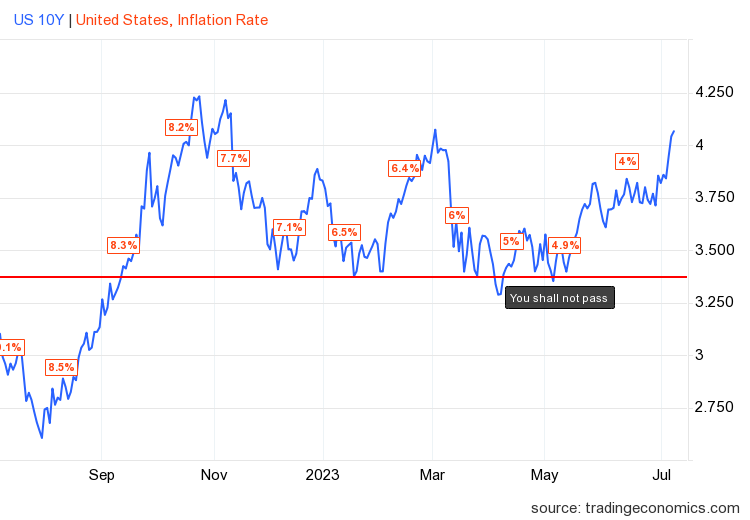
In my 2023 forecast, I said: If the economy stays firm, the 10-year yield range should be between 3.21% and 4.25%, equating to mortgage rates between 5.75% and 7.25%. The labor market remains healthy as long as jobless claims trend below 323,000 on the four-week moving average. As we can see below, the 10-year yield has stayed in this channel 100% of the time in 2023, but mortgage rates are on the verge of breaking over 7.25%.
As the spreads between the 10-year yield and mortgage rates have worsened since the banking crisis, this has added more pressure on rates to be higher than I would have anticipated in 2023. The chart below shows the spreads rising after the SVB banking crisis started.
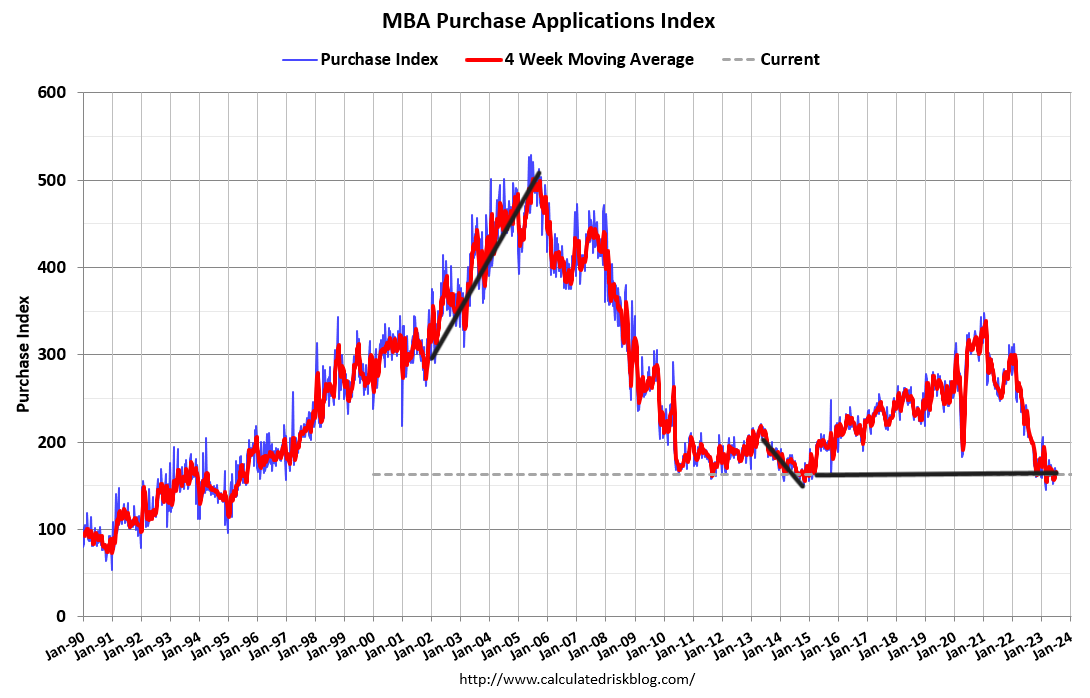
Purchase application data
Purchase application data was down 5% weekly, making the count for the year-to-date data 13 positive and 12 negative prints. If we start from Nov. 9, 2022, it’s been 20 positive prints versus 12 negative prints. Considering mortgage rates have been near 7% and above the last month, having three out of the last four weeks being positive shows that the collapsing market in 2022 did change after Nov. 9.
But remember: The bar is so low with purchase apps that we can trip over it. As long as we know that the data has just stabilized from a waterfall dive, we are all in the same boat with the data this year.
The week ahead: Inflation week!
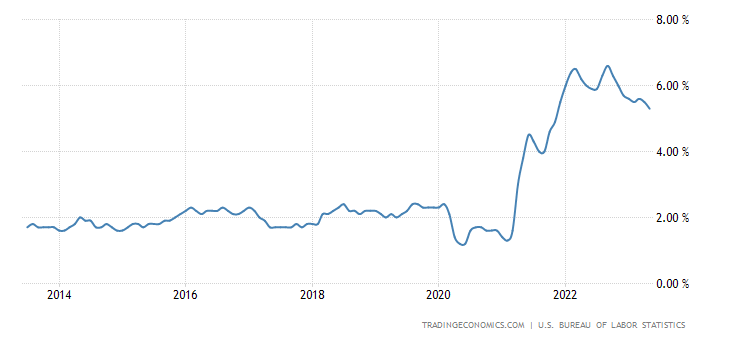
Inflation week is here again, and we have two inflationary reports to work with. Between the critical CPI data and the PPI data, we should see the same story: the headline inflation data is falling noticeably, but the core inflation data is a bit more sticky. Still, the shelter aspect of inflation will kick in more here, with used car prices falling over the next few months. Below is the year-over-year core CPI data.
Considering where we are with the 10-year yield and mortgage rates, a lighter-than-expected CPI inflation print this week would be just what the housing market needs to bring mortgage rates lower.