Housing inventory finally broke under 2022 levels last week. To give you an idea how different this year is from last year, last week in 2022, active listings grew 30,940 while this year they only grew 5,848. Mortgage rates rose last week after the better-than-anticipated jobless claims data but even with higher rates, we also had a third week of positive purchase application data.
Here’s a quick rundown of last week:
- Active inventory grew by a disappointing 5,848 weekly
- Mortgage rates went above 7% again after better labor data
- Purchase application data showed 3% growth week to week
Weekly housing inventory
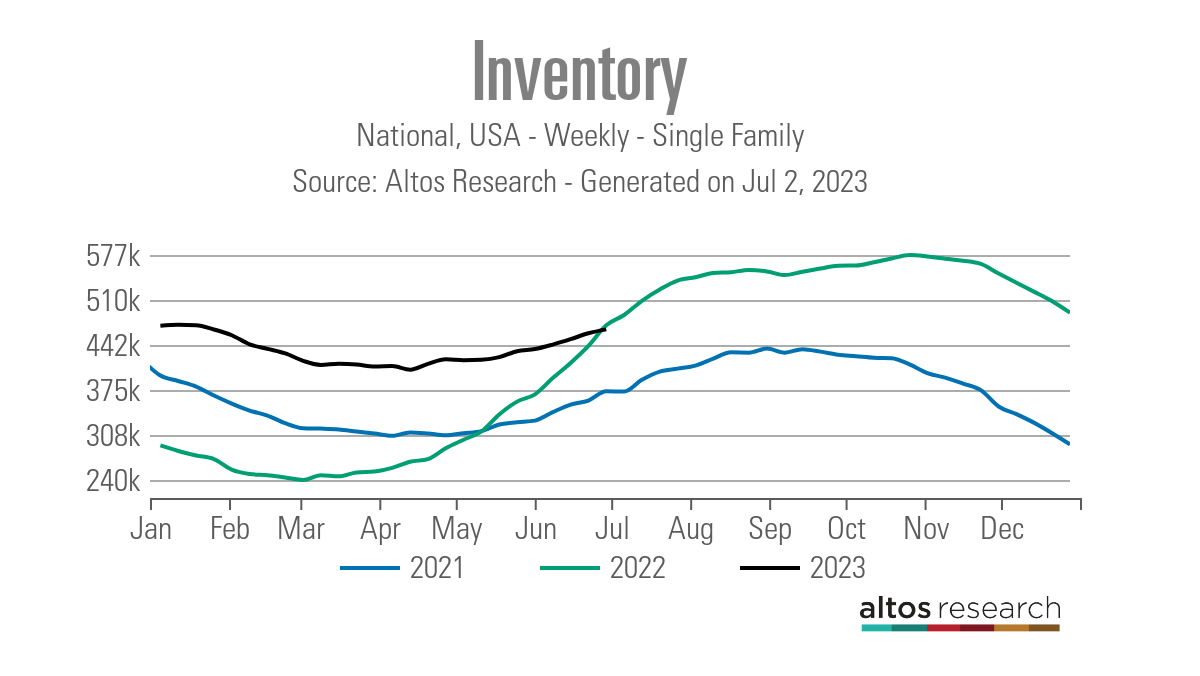
On May 15, I went on CNBC and talked about how inventory growth in 2023 resembled a zombie from the show The Walking Dead, slowly trying to rise from the grave. Since May 15, that trend has continued to the point that inventory in America is now negative year over year.
We have often discussed that the housing market dynamics changed starting Nov. 9, 2022, and today you can see the final result of that dynamic shift as inventory is now negative versus the 2022 data — all before July 4th. I recently recapped this crazy period on the HousingWire Daily podcast, going into detail about what happened in housing over the last year.
- Weekly inventory change (June 23-30): Inventory rose from 459,907-465,755
- Same week last year (June 24-July 1): Inventory rose from 441,106 to 472,046
- The inventory bottom for 2022 was 240,194
- The inventory peak for 2023 so far is 472,688
- For context, active listings for this week in 2015 were 1,183,390
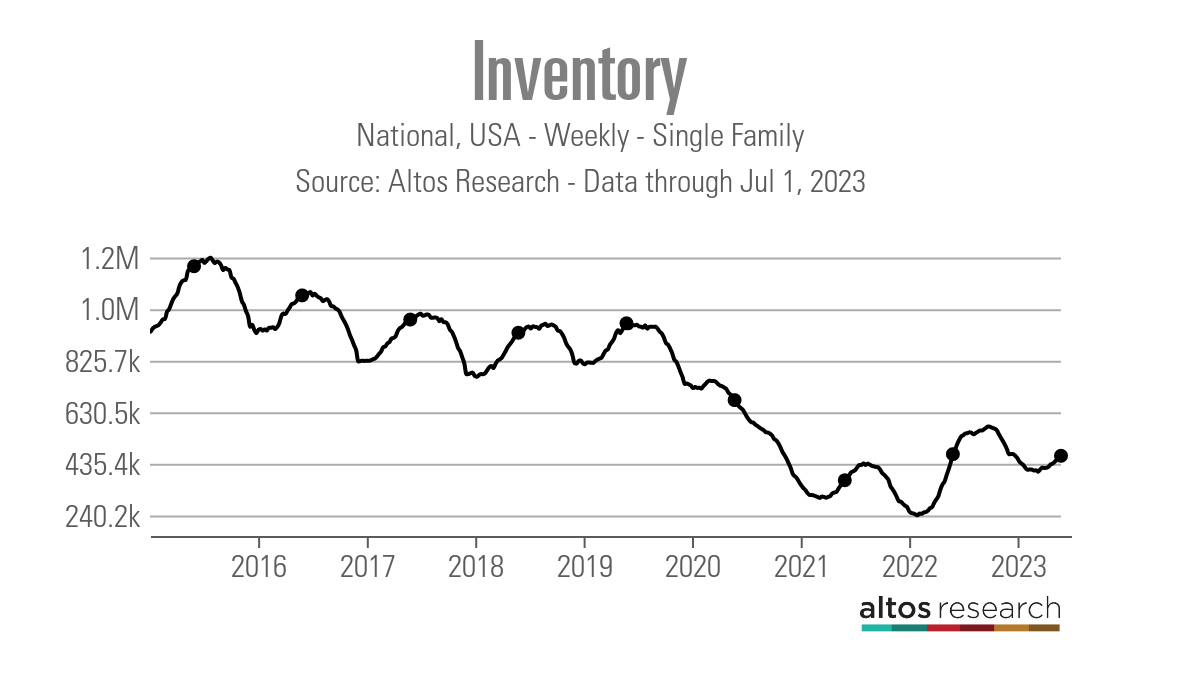
Seeing negative year-over-year inventory before July 4 would be a big deal if last year wasn’t so crazy. However, I need to put some context into what happened in 2022. In March of 2022 we had the lowest inventory levels ever recorded in history. Then in a short amount time, we had the biggest and fastest mortgage rate spike in history, which facilitated the biggest one-year crash in home sales in history, which helped inventory grow faster than normal in 2022.
So the fact that housing demand stabilized and inventory is now negative year over year needs the context that 2022 was a once-in-a-lifetime event. As you can see in the chart below, 2023 inventory growth is very slow compared to 2022.
The other big story with housing inventory is that new listing data has been trending negative year over year since the end of June 2022. A traditional seller is also a traditional buyer, and certain homeowners have refused to buy their next home with mortgage rates above 6%.
We had new listings growth from 2021 to 2022, but that’s not the case this year. This is another variable contributing to slow inventory growth, which has now turned negative in the weekly listings.
Compare the new listings data last week to the same week in recent years:
- 2023: 62,466
- 2022: 91,530
- 2021: 80,289
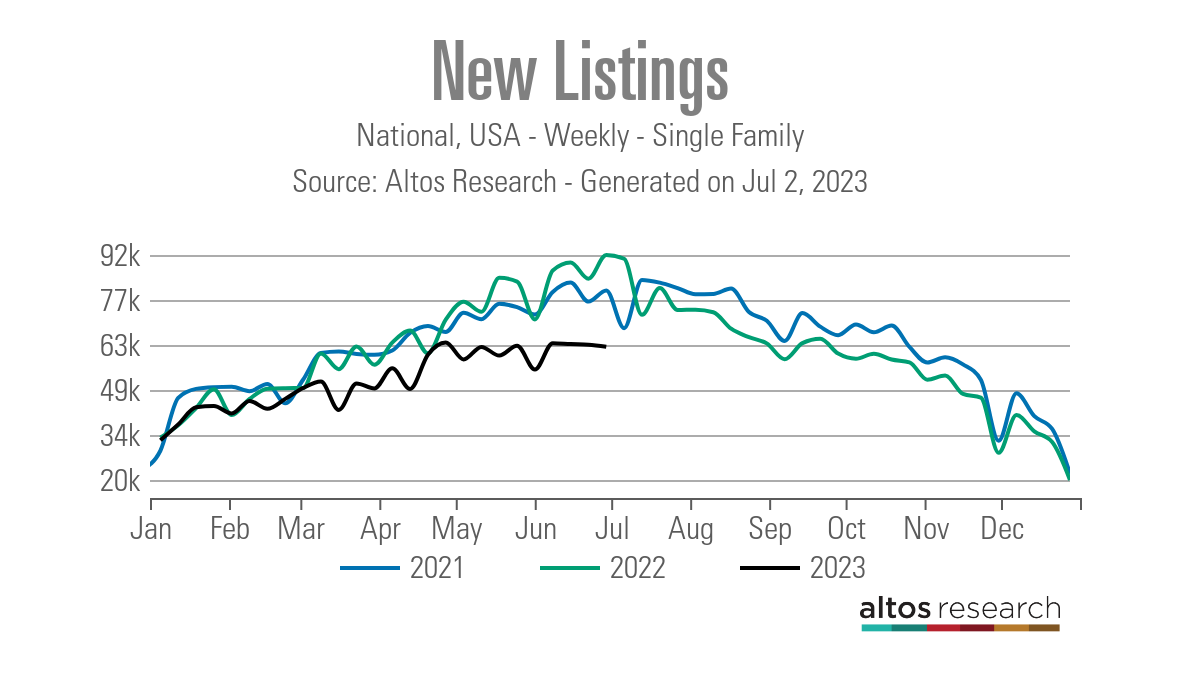
My concern lately is that we have seen four straight weeks of mild declines and are about to head into the seasonal decline period of new listings. This is one data line I will track like a hawk because it will be a negative for the housing market if this data line makes a noticeable year-over-year decline trend in the second half of 2023.
The 10-year yield and mortgage rates
For those who have followed the weekly Housing Market Tracker articles, I always focus on jobless claims data as it’s the critical data line at this point of the economic cycle for me and my forecast in 2023 for mortgage rates.
Last week we had a big move in the 10-year yield because jobless claims came in better than anticipated, and bond traders were caught off guard selling bonds on the news and sending mortgage rates above 7% again. As you can see in the chart below, that big spike was really about jobless claims getting better.
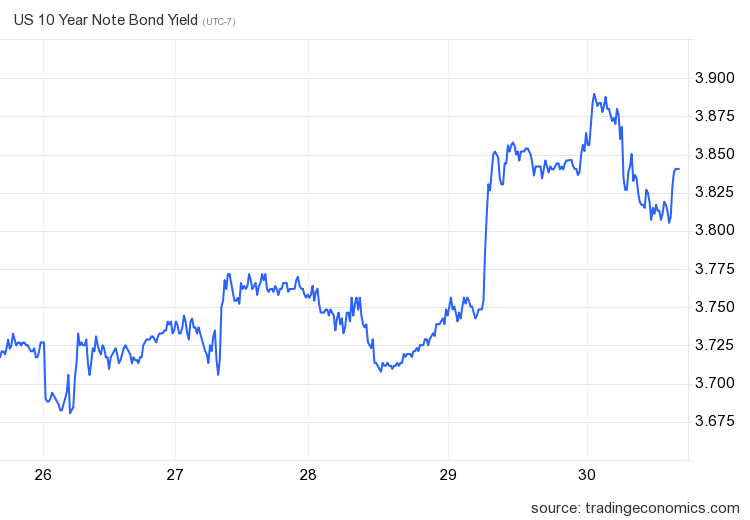
The following day, the PCE inflation data showed a cooling down in headline inflation year over year. Core PCE inflation is a bit more sticky than headline inflation, however, bond yields fell after that report and bounced back at the end of the day.
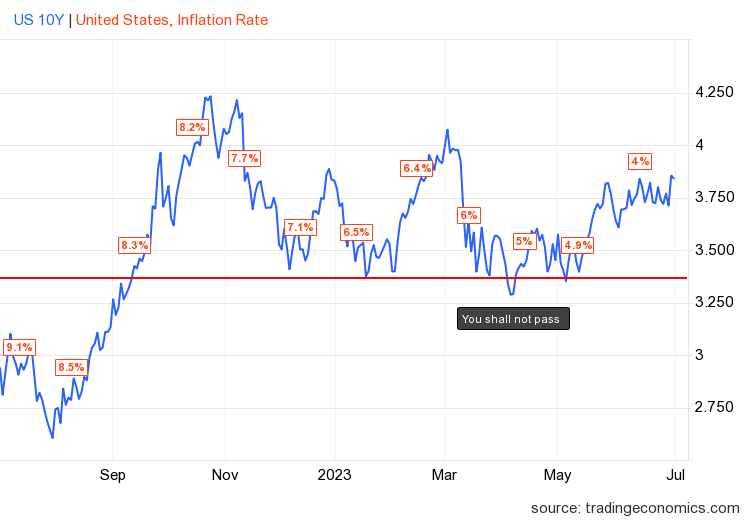
In my 2023 forecast, I wrote that if the economy stays firm, the 10-year yield range should be between 3.21% and 4.25%, equating to mortgage rates between 5.75% and 7.25%. As long as jobless claims trend below 323,000 on the four-week moving average, the labor market stays firm, which means the economy remains healthy. Jobless claims have stayed below this range all year, and job openings are still at 10 million.
I have also stressed that the 10-year level between 3.37% and 3.42% would be hard to break lower. I call it the Gandalf line in the sand: You shall not pass. The setup for the 10-year yield to stay in the range is intact.
The counter to my 10-year yield range would be if the economy here or worldwide starts to accelerate higher; that would be a valid premise to get the 10-year yield above 4.25%. Considering our economy this year, the 10-year yield and mortgage rates look about right to me.
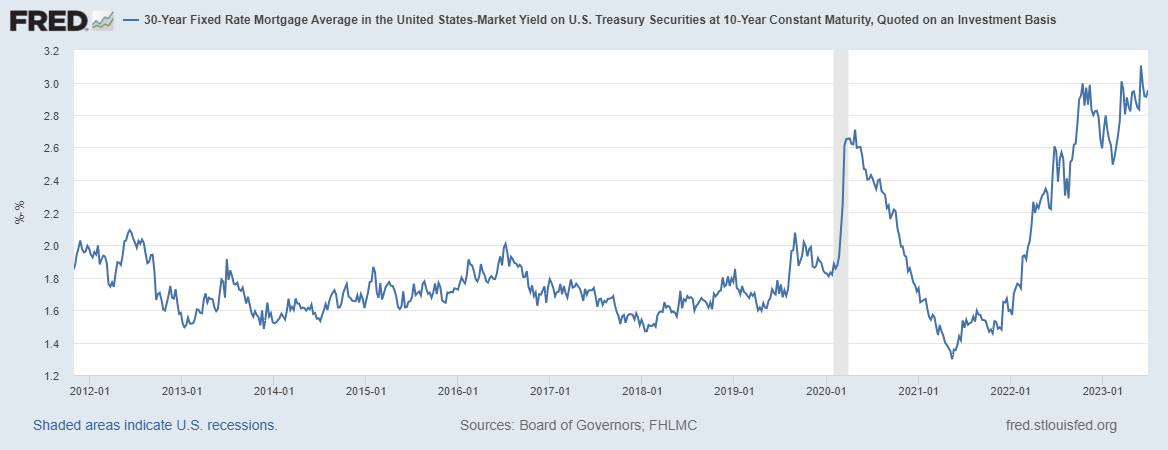
Now the one thing that has changed in 2023 is that since the banking crisis, the spreads between the 10-year and mortgage rates have worsened, making mortgage rates higher than I anticipated versus the 10-year yield, which is not a positive for the housing market.
We haven’t seen anything in the data showing that it’s been improving recently. This is a big deal as we have seen housing inventory not get much traction with higher rates and hopefully in the future, lower rates can entice some sellers to move.
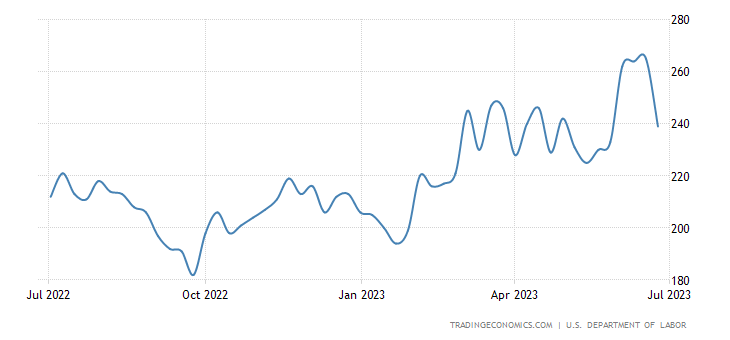
On jobless claims data, I always stress using the four-week moving average with this data line because we do have times when this data line can get hectic week to week. Therefore, I only believe the low jobless claims print once I see weeks of this data line improving. So, it will be critical over the next two weeks to see if this decline was a one-time blip in the data, which we have seen from time to time. As you can see below, that was a significant drop week to week, which looks abnormal to me.
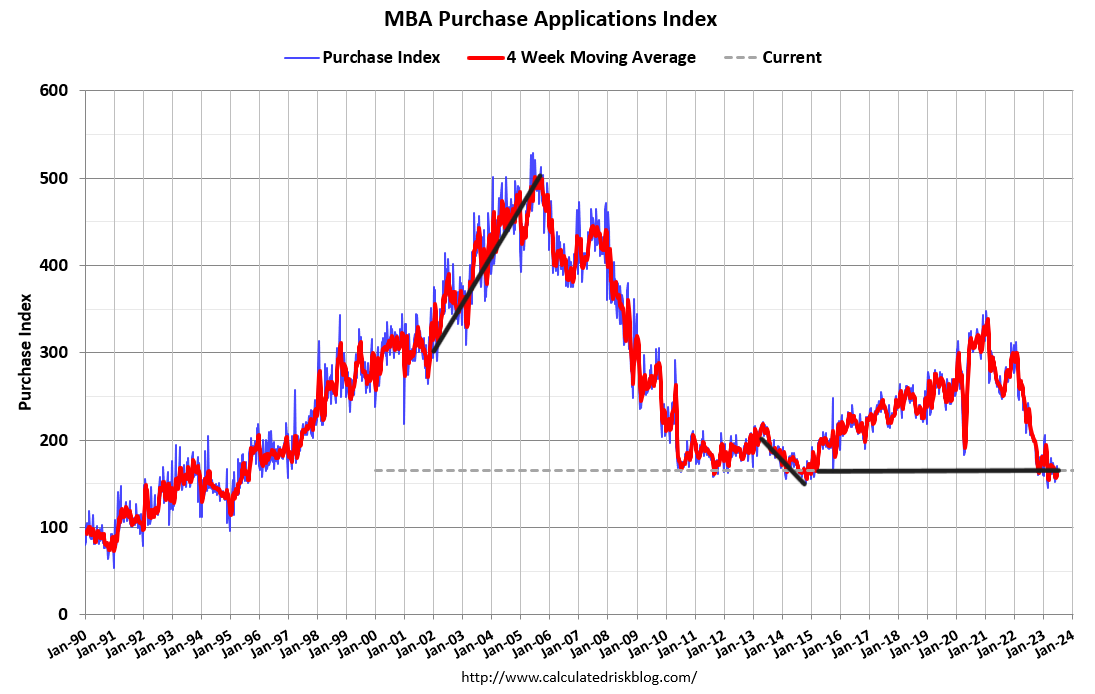
Purchase application data
Purchase application data has surprised people with three weeks in a row of growth, while mortgage rates have been near 7% during this period. This now makes the positive count since Nov. 9, 2022, 20 positive prints vs. 11 negative prints. The year-to-date numbers are 13 positive vs. 11 negatives after making some holiday adjustments to the data line.
What do these numbers mean? They just mean that housing data has stabilized; nothing in the data shows decent growth after that first good move from November to February. However, the fact that housing demand has stabilized is a big deal because last year, we did have a waterfall collapse in the data, as shown in the chart below. The only downside to this is that we haven’t had the housing inventory growth I would like.
Now the year-over-year decline was down to -21%, which was the lowest since Aug. 24, 2022. However, we all have to remember that the second half of 2023 will have much easier comps, so even if demand stayed the same the rest of the year we will have some positive year-over-year data at some point.
Be careful in reading too much into the better year-over-year data we will see in the future. The most recent pending home sales print came in as a miss from estimates, but the existing home sales data is still trending in the range I thought it would be in since I believed that first big print we had a few months ago was going to be the peak for year. When demand is coming back in a big way, purchase apps will be positive for a majority of the weeks as we are working from such low levels today historically.
The week ahead: Jobs, jobs and jobs data
Yes, it’s jobs week once again and with four labor reports coming up on this short holiday week, we’ll be able to see if the Federal Reserve is getting what it wants — a softer labor market. Recently, Fed Chair Powell once again stressed that the labor market is too tight and that softer labor is the way to get inflation down to the Fed’s 2% core PCE target.
Well, we have four reports this week: the job openings data (JOLTS), the ADP jobs report, jobless claims and the big one on Friday — the BLS job report — so we’ll see what happens.
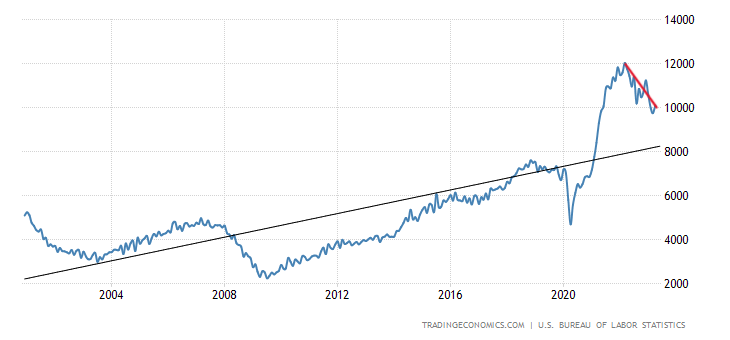
So much of my COVID-19 recovery model was based on the labor dynamics being much different now, since I was the only person talking about job openings getting to 10 million in this recovery. Today as I write this, we are still at 10 million job openings, as the chart below shows.
I have a firm belief that the Fed doesn’t fear a big job-loss recession as long as job openings are this high. What they have enjoyed seeing is wage growth cooling down, as shown in the BLS job reports for 18 months now. So, for this week, we always focus on jobless claims data over everything else, but be mindful of the job openings data since the Fed wants to see this go down, and the wage growth in the BLS jobs report data.