
After seeing disappointing inventory growth two weeks ago, which I chalked up to the Memorial Day holiday, I was hoping for a big push in active listings last week, but that didn’t happen. And, the recent uptick in mortgage rates to almost 7% slowed purchase application data again.
Here’s a quick rundown of the last week:
- Active inventory grew 6,722 weekly. I had anticipated much more this week after the holiday week slowed down, so a bit disappointing.
- Mortgage rates stayed in a small range between 6.89% – 6.94%
- Purchase application data had its fourth straight week of negative data as rates near 7% slowed down demand.
Weekly housing inventory
We have two big housing inventory themes in 2023 that must be discussed. First, it took the longest time in U.S. history to find the seasonal bottom this year — all the way to April 14, which is highly abnormal. I did a podcast on why I believe this is happening post-2020 when it wasn’t normal in the past.
Second, inventory growth hasn’t been the significant story year to date. Still, at least we have had some of the traditional seasonal inventory growth in 2023, giving us more inventory than last year. While this week was disappointing because I was expecting active listings to grow by around 11,000-12,000, I will take the 6,722 number.
- Weekly inventory change (June 2- June 9): Inventory rose from 436,284 to 443,006
- Same week last year (June 3 June 10): Inventory rose from 368,436 to 392,792
- The inventory bottom for 2022 was 240,194
- The peak for 2023 so far is 472,680
- For context, active listings for this week in 2015 were 1,182,681

The growth in housing inventory this year has been so slow that I call it the walking dead — a slow zombie rising from the grave, something I talked about recently on CNBC.
As you can see in the chart below, the inventory growth has been so slow that if the current trends continue, we will show negative year-over-year inventory prints. It’s not like we are using a high bar for comps; 2022 had the lowest inventory ever recorded, and we still have a good shot of showing some negative year-over-year inventory prints soon.
Of course, we have a third story in this U.S. inventory saga: after mortgage rates spiked above 6% in 2022, that jump-started the unhealthy reality of new listing data trending negative year over year. This wouldn’t be a big deal in regular times, but new listing data was already trending at all-time lows in 2021 and 2022, so this year’s new listings are trending at a fresh new all-time low.

So much for the 2021 grifting premise that once mortgage rates rise, many Americans will list to sell and get out! Here are the number of new listings for this week over the last several years for perspective:
- 2021: 79,827
- 2022: 86,625
- 2023: 63,583
After 2010, housing inventory can grow in the U.S., but it needs weakness in demand and days on market to grow so inventory can accumulate. This happened in 2014 and 2022 when we saw a weakness in demand. With the year almost over, it will be interesting to see if this occurs again because purchase applications finally turned negative for the year.

Purchase application data
Purchase application data has been critical to my work on gauging actual demand for the year and how it should look for the next year if we have a material change in the markets. Last week, I wrote a diary of what happened in the second half of 2022 and extending into this year to explain why home prices aren’t crashing in 2023.
This year has been a back-and-forth battle of positive and negative purchase application data. Before last week, we were split between 10 negative and 10 positive prints. However, as mortgage rates headed back over 7% and have been hovering around this level for some time, it has created four straight weeks of negative purchase application data.
While this weakness isn’t creating the waterfall dive in demand we saw last year; it will still show up in the sales data over the next few months.
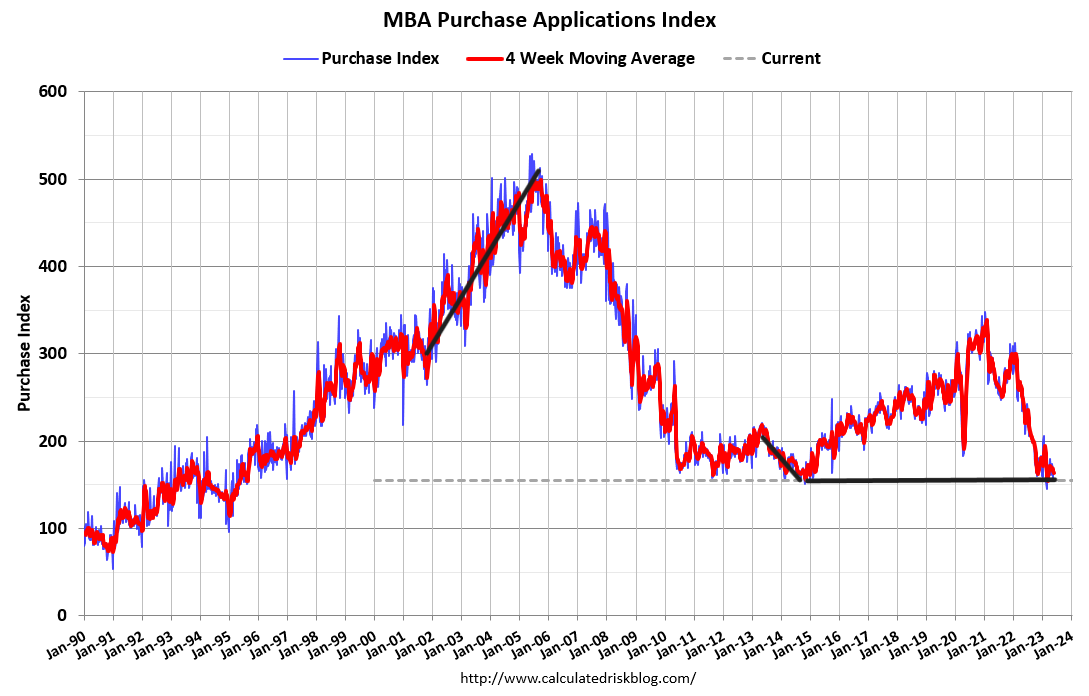
Even though purchase applications were only down 2% last week from the week before, it’s still softness. Of course, if mortgage rates fall like in the past this year, this data line can return to being positive for the year. It’s just been one of those years without a key direction one way or another because rates have been in a range between 5.99% to 7.14%
The 10-year yield and mortgage rates
Last week we had some drama with the 10-year yield; between surprising rate hikes from Canada and Australia and some exciting bond market auction news, the 10-year yield made a solid move higher. Then it faded with some of the weak news after jobless claims rose noticeably and it didn’t look like it was tied to just one bad city.
In my 2023 forecast, I wrote that if the economy stays firm, the 10-year yield range should be between 3.21% and 4.25%, equating to mortgage rates between 5.75% and 7.25%. I have also stressed that the 10-year level between 3.37% and 3.42% would be hard to break lower. I call it the Gandalf line in the sand: “You shall not pass.” Yes, it might be corny, but I believed that this level would be difficult to break under.

So far in 2023, that line has held up, as the red line in the chart below shows. Mortgage rates have been in the range of 5.99%-7.14%, however, we do have some issues in the mortgage market. I added the year-over-year inflation growth level in the chart below because this is Inflation week!
Since the banking crisis started, the spreads between the 10-year yield and 30-year fixed mortgage rates have gotten worse, keeping mortgage rates higher than usual. As shown below, spreads made a noticeable turn when the drama started and haven’t returned to the pre-drama trend.


Another aspect of my 2023 forecast is that if jobless claims break over 323,000 on the four-week moving average, the 10-year yield could break under 3.21% and head toward 2.73%. Last week we saw a noticeable move higher in jobless claims, and it doesn’t look like a one-week distortion from one state. We always want to see more weeks to confirm a trend, but this last week caught a few people by surprise.
From the St. Louis Fed: Initial claims for unemployment insurance benefits increased by 28,000 in the week ended June 3, to 261,000. The four-week moving average increased to 237,250.

The week ahead: Inflation and Fed week!
It’s that time again when we get ready for the inflation data showing a slowing year-over-year growth trend with the CPI and PPI report this week. The Federal Reserve meets this week, and most everyone agrees that they will pause rate hikes this month and wait for July to see if they need to do more to create their job-loss recession.
This week, we have some manufacturing and confidence data with bond market auctions that might create drama. However, the focus should be on inflation, the Fed, and jobless claims data on Thursday morning.
What we want to hear is the language from Chairman Powell. If the Fed genuinely believes in their hope to try to create a soft landing, then they should be closer to the end of their rate hikes due to the lag impact of rate hikes and the fact that credit is getting tighter due to the banking crisis of this year.

