When economic data that is typically sticky has a waterfall dive followed by a quick parabolic recovery, forecasting a trend can be tricky. The MBA purchase application data changed during our year of COVID-19.
In a typical, non-pandemic year, the bulk of the volume of purchase applications occurs in the heat months for housing, those being the second week of January to the first week of May. By the end of May, purchase application volumes start to fall. Every year, we get some rookies that think the post-May decrease means that housing is crashing. Don’t be one of those.
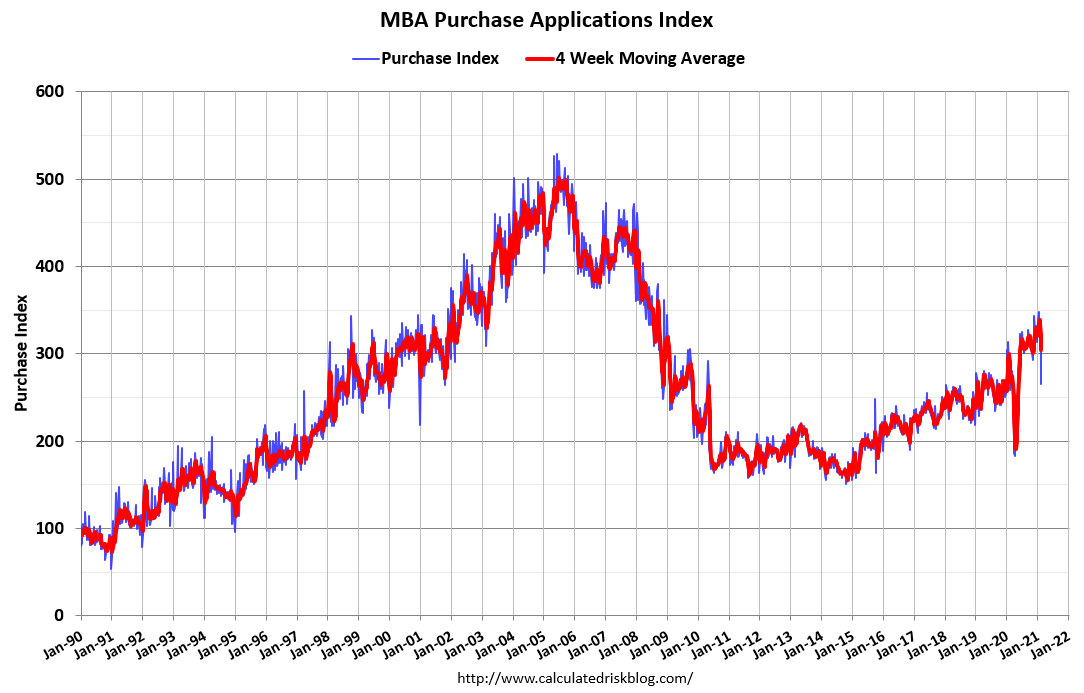
When we keep this data line’s seasonality in mind, we can get a pretty good picture of the housing market’s health. When the housing market isn’t doing great, purchase application data shows negative year-over-year data for the entire year. The last time we had a negative year-over-year decline in purchase applications was in 2014. That year purchase applications were the lowest ever when adjusted to the population.
Since 2014, purchase applications have been rising. In 2020 we finally cracked the 300 level in the purchase application index — something I didn’t believe was possible during the years 2008 to 2019.
Because the COVID crisis so distorted the purchase application data for 2020 after March 18, the year-over-year data for 2021 is going to be misinterpreted as well.
Even with that distortion in mind, purchase applications for 2021 have been stronger than I expected. I anticipated year-over-year growth in this early part of the year to be between 1% and 11%. So far, we are running at 12.375% year-over-year growth.
When projecting a trend for this metric, I typically don’t count the first week of January, which in 2021 had the slowest growth at 3%. Last week we had a holiday, and the Texas snowstorm, two factors that have the potential to slow down purchase applications. Even so, we had 7% year-over-year growth. If we remove the first week of January and last week as outliers, we are trending at 14.83% year-over-year growth. This year is the highest level of a year-over-year growth trend since 2016, but now it’s working from a pre-cycle high, big difference.
Starting the week of March 22 to the beginning the June, the year-over-year comparison will be against the worst COVID-19 months of 2020. We will likely see super year-over-year growth that should not be considered a boom in the housing market.
For the second half of 2021, the year-over-year comps will be distorted as well. The COVID shutdown period caused pent-up demand, resulting in the parabolic rise in purchase applications, pending home sales, existing home sales, and new home sales. Remember, too, that the housing market in early 2020, before COVID-19 hit, was breaking out. It was off to a solid start, so it is not surprising that housing would be the best-performing sector in America and the world once people lost their fear of the virus.
When you have the best housing demographics ever along with the lowest mortgage rates, demand will stabilize.
Before COVID-19 hit last year, purchase application data was trending at 10% growth year over year. Suppose we accept that our current year-over-year growth is at a healthy 14.83%. In that case, we can still expect many weeks of negative year-over-year growth during the second half of 2021 because we compare this period to the period of parabolic growth of 2020. In 2020 we had 22 weeks of purchase application data growing over 20% and six additional weeks of 15%-19% year-over-year growth.
The take-home here is that even though we are in a healthy housing year, we may have 26 weeks of negative year-over-year growth in purchase applications. Expect this, and don’t be fooled.
I can already tell you; people will overreact to the news of negative year-over-year growth and make it seem like something it is not. The housing bubble boys are hungry; they’re embarrassed that last year housing didn’t collapse, and they need to troll hard when this data comes out.
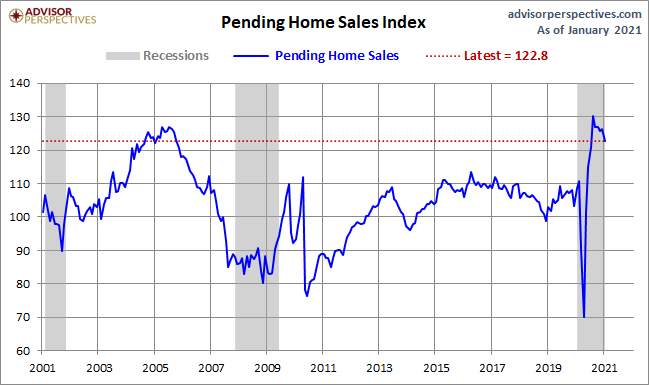
The recent pending home sales data to me still looks too high. We haven’t moderated enough from the parabolic rise in home sales last year. The recent report showed 13% year-over-year growth; in the upcoming months, the year-over-year data will look too strong even if the headline number falls lower because we are about to get some very easy comps. This data line also will have some negative year-over-year prints in the second half. Since we are still elevated in sales data in 2021, this will spill over to 2022 to a much smaller degree. From the NAR report:
“Nationally, pending home sales decreased 2.8% in January from the prior month.”
Existing home sales are in the same boat. I have always stressed that if we didn’t end 2020 at 5,710,000 – 5,840,000 in existing home sales, then COVID-19 took demand off the table. That is how good February 2020 existing home sales were before COVID-19 hit us.
Purchase application data is much stronger this year than even I thought would be the case, and this I believe is mostly because we never got back all the demand that COVID-19 took from us in 2020. I was mindful of this happening, so I have mentioned that early in 2021, we should still be in makeup mode. Perspective is needed with existing home sales, as we only ended the year at 5,640,000 in sales, which is only 130,000 more than the total levels in 2017.
Be prepared for some negative year-over-year data in the existing home sales market in the second half of 2021. A good rule of thumb to remember for 2021 is that if the monthly existing home sales don’t go toward 6.2 million and below, demand is better than I thought for 2021.