

Economic cycles are like serial killers on a Netflix show: they leave clues to get caught. Interpreting these clues gives you the ability to see when the economy is in recovery and when things are about to go into recession. My job as a data analyst is to provide the map you need to follow these clues, specifically as they relate to housing.
Each economic sector behaves differently in a recession; typically, the industry with the most leverage on growth gets hit the hardest. This was the case for housing during the lead-up to the bubble years as housing data went criminally insane in the years 2002-2005.
As we close in on Thanksgiving, we can be grateful for the recent excellent jobs report, which shows that the housing crash fanatics have failed once again in 2021. But during any economic expansion we can expect to see the occasional red flags warning us of the next economic recession. Some of these flags will just be noise in the system that can be ignored, while others may indicate actual cracks in our foundation that need to be heeded. The trick is being able to distinguish between the two.
Regarding the U.S. housing market, no single metric can herald an oncoming slowdown; it will require several factors signaling in concert for the warning to be meaningful. I’ve outlined these factors below.
First, take COVID-19 data out of the equation
The COVID-caused recession was an anomaly both in its onset and duration. After a decade of slow and steady growth, housing broke out in February of 2020.
Not only did housing data look expansionary, but so did many data lines. Jobs data looked solid, retail sales grew year over year, and manufacturing data was positive again. Economic data, in general, was on an upturn toward the second half of 2019 and the first two months of 2020, only to be slapped down by the COVID-19 brief, but deep, recession.
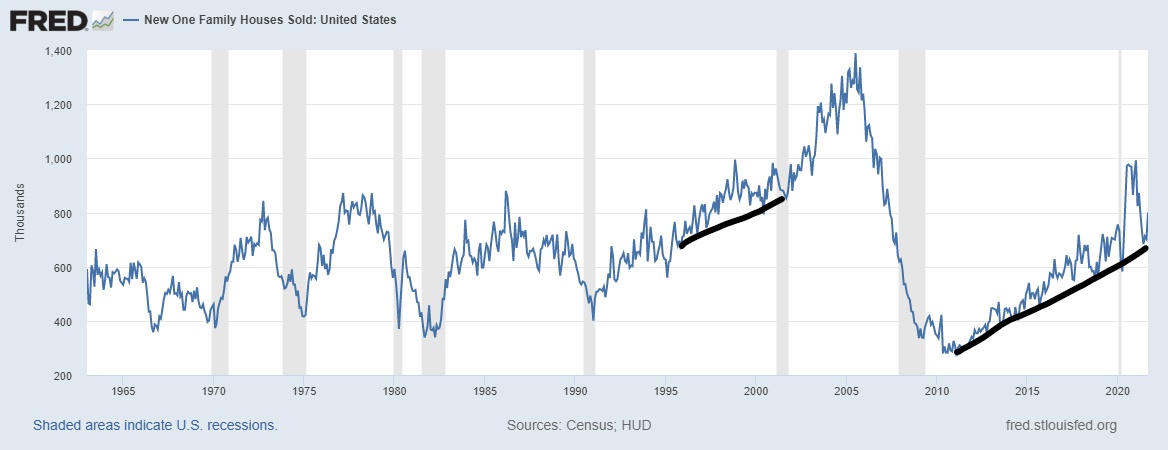
Traditionally, housing starts and new home sales get weaker before a recession, but we didn’t have time for this to happen before the artificial shutdown of the economy.
Before the COVID-19 shutdowns, from 2008 to 2019, we had the weakest housing recovery ever after the housing bubble burst. Our demographics in the U.S. were both too young and too old to support a vigorous recovery. Sales growth was slow, with many years when new home sales missed expectations. Starting in the year 2020, however, the U.S. began a period (that will run until 2024) when we have the best demographics for home buying ever, which just happened to begin at the same time the economy took a hit due to COVID-19.
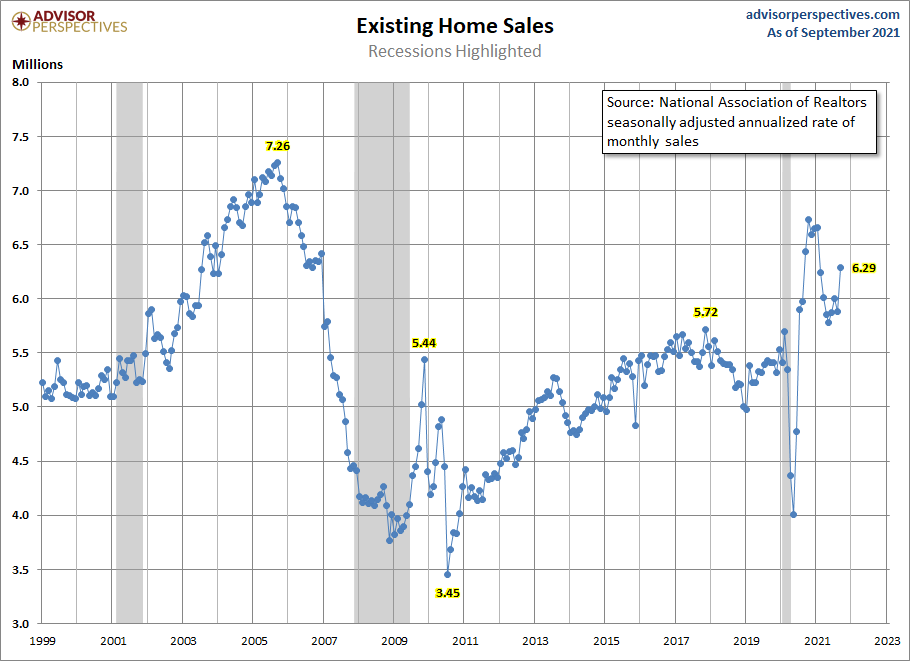
Now that we are recovered from a worldwide pandemic — and thanks to our demographics — the housing market has more robust demand than what we saw from 2008 to 2019. During 2020-2024, total home sales (new and existing homes) should be 6.2 million or higher. We are seeing unhealthy price inflation for shelter, not only in home buying but also in rents. Demographics equal demand, and we have a lot of people ages 27-33. I mean, this age group is the biggest ever recorded in U.S. history.
However, I wouldn’t categorize this period as a housing boom. We do not see an explosion expansion in credit or a significant uptick in the number of mortgage buyers as we saw from 2002-2005. With that in mind, you can ignore both the super housing bulls that believe we should be having a construction boom and mega housing bears who think we’re on the verge of a housing bubble collapse back to 2012 levels. Neither of these things will happen.
Look at monthly supply of new homes
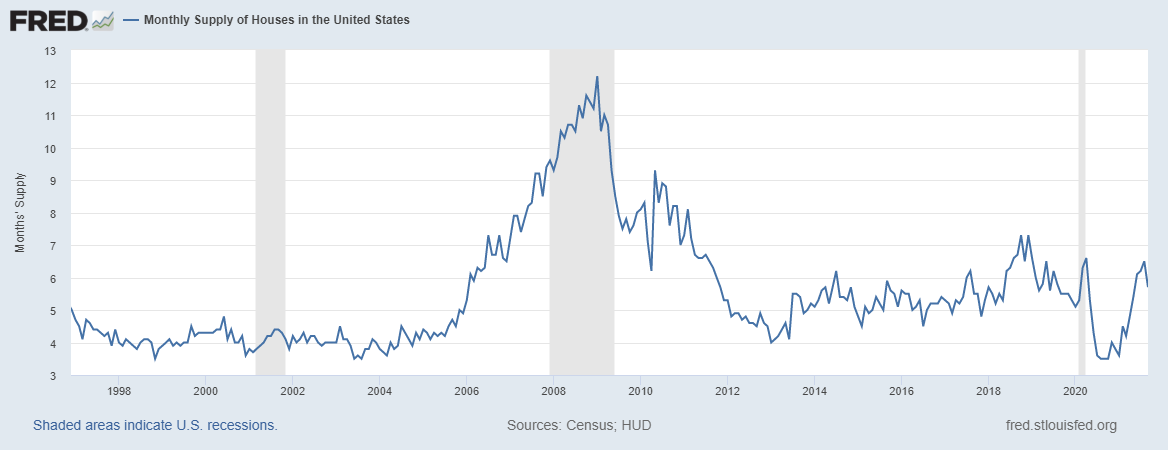
With that context in mind, the first sign to look for to indicate that the housing market is slowing is the monthly supply of new homes going over 6.5 months on a three-month average. We saw this happen in late 2018, but at that time, housing starts were low, and housing, in general, was sluggish, so a longer monthly supply just sort of fit into the background.
If that were to happen today in this market, it would be a different story. 2022 will be the first year that housing starts go over 1.5 million. We no longer have a sleepy background of housing activity to hide our signals that the market might be slowing.
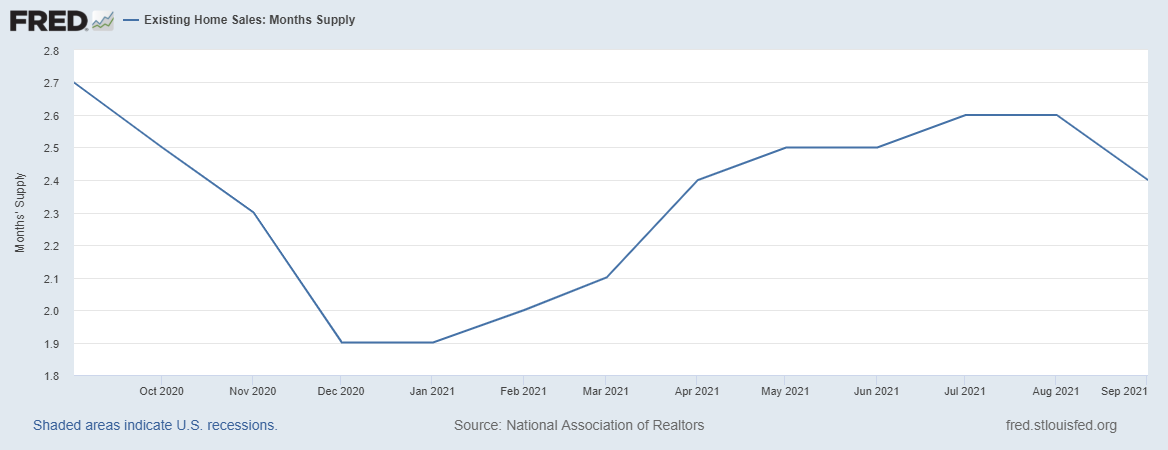
The new home sales market is already at 5.7 months of supply, while the existing market is at 2.4 months. Inventory in the new home sales market is more likely to grow as mortgage rates rise than the existing home sales market because this market depends more on mortgage buyers. New homes are also a more expensive product than an existing home, even with the builders’ attempts to balance the difference out in recent years.
This year, we had a spike in monthly supply from a shallow level and got one month of supply at 6.5 months. However, the recent new home sales report showed that the market has stabilized from the recent increase and the three-month average is currently at 6.1 months.
New homes monthly supply:
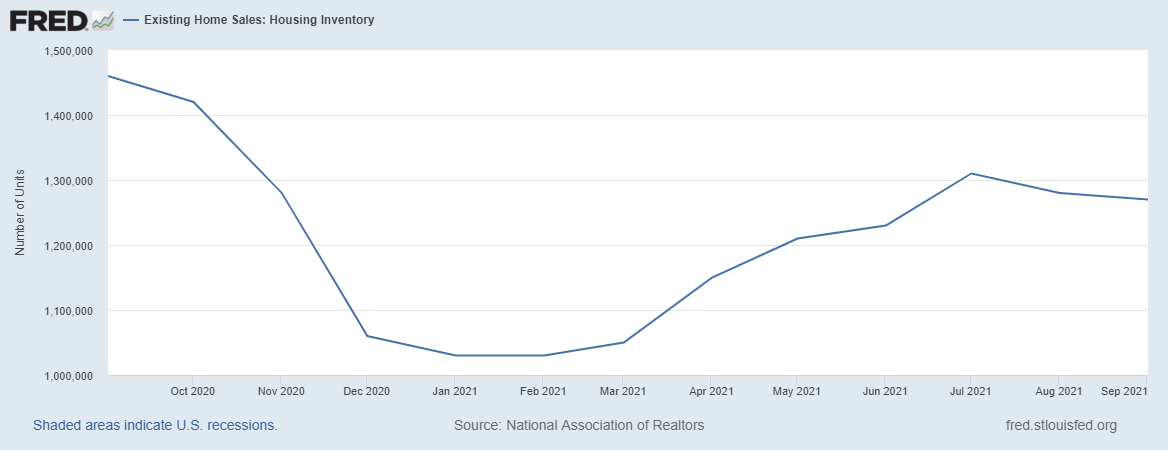
Existing home monthly supply:
Pay attention to how mortgage rates affect demand
In the summer of 2020, I wrote that mortgage rates over 3.75% could cool housing demand and that we would see weakening demand in the new home sales market first. Once the monthly supply gets over 6.5 months, homebuilders will pull back on single-family housing construction, then multifamily construction, if demand continues to weaken.
Today, mortgage rates are lower than they were in 1990, 2000, and 2008, so don’t think that housing demand will collapse, even if we do get a slowdown. We don’t have a credit boom or a construction boom, so we won’t have a waterfall collapse like what we saw from the peak of 2005.
The biggest concern we have in the current housing market is unhealthy price growth, a problem that is front and center in the new home sales market. I believe the builders did a great job with their margins as they passed on the higher costs of housing for their customers, but they’re mindful of pushing this too much. Remember, we haven’t had rates really rise yet and they’re mindful of what happened back in 2013 and 2018 when rates moved higher.
Monthly supply over 6.5 months on a three-month average is a warning sign for the new home sales sector but doesn’t do much to the existing home sales market, as we saw in 2018. At this point, we want to see total inventory levels for the existing home sales market rise.
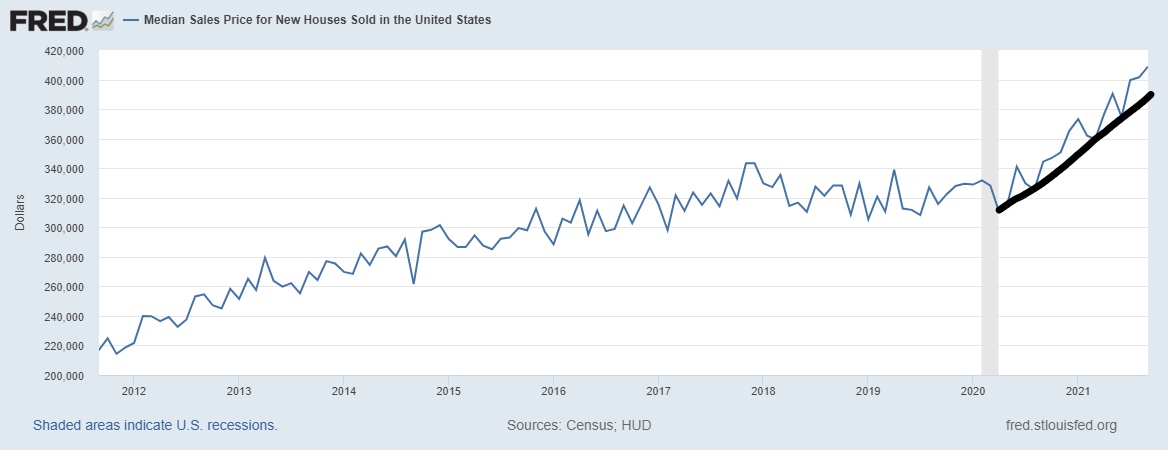
I would like to see total inventory get above 1.52 million because our current low level of inventory is causing unhealthy price growth. Home price growth in the last two years has surpassed the level I set for the years 2020-2024, which was a cumulative growth level of 23% to be considered OK. I am rooting for an increase in inventory to cool down prices and get my model back on track, which would need three years of cumulative negative home price growth of 3%. As you can see, I am in a rough spot here with total inventory levels below 1.52 million and mortgage rates below 3.75%.
If mortgage rates go over 3.75% (which means the 10-year yield would break over 1.94%), expect some softening in housing, just not an epic crash. However, this scenario was not part of my forecast in 2021, as I didn’t forecast the 10-year yield to go over 1.94%, and we have less than two months left in the year.
Watch for mortgage credit getting tighter
Tighter credit also has the potential to cool demand. But like higher mortgage rates, I don’t see this happening anytime in the near term. Unlike the last administration, which was keen to take the GSEs private, the current administration has no desire to do that. Government lending didn’t get tight during the brief COVID recession. Non-QM lending did take a hit, but it makes up such a small part of the market, that hit was barely noticed.
Rest assured that lending is very tiresome these days. We don’t have a credit boom or exotic loan debt structures adding risk to the system. Don’t expect mortgage credit to get tighter or to get easier, for that matter. If we see credit standards easing, I will be first in line for the congressional hearing to say this is wrong. But I’m not polishing my shoes yet.
Don’t equate this market with 2008
The mortgage market of 2018-2021 looks a lot different than it did in 2002-2005. But then everything looks different now. New home sales, existing home sales and housing starts show solid demand but not the booming market as we saw from 2002-2005.
In 2014 purchase application data was on a downtrend of -20% year over year, and inventory levels were much higher than today.
,
The existing home sales market, on the other hand, was stable. In 2018, 5% mortgage rates cooled housing demand and created negative real home price growth in 2019, but it didn’t crash the market. When the existing home sales market housing gets weaker, we see it in the year-over-year data from the second week of January to the first week of May of the MBA’s purchase application data. We saw that happen during the first few weeks of COVID-19 when demand dropped over 30% year over year in that data line.
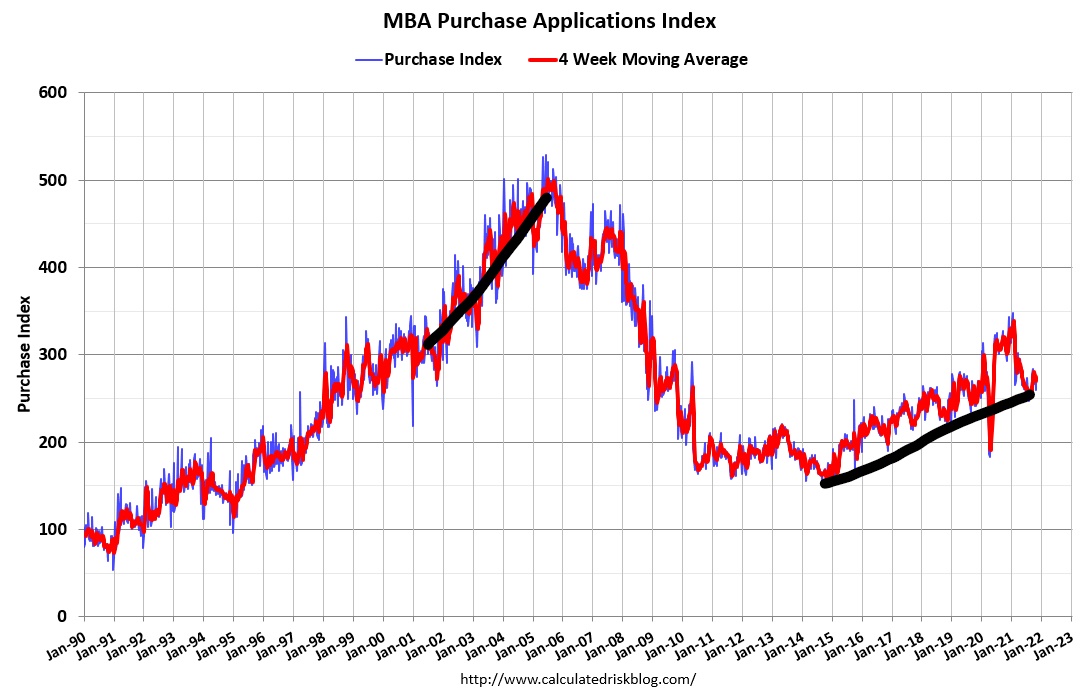
However, it quickly recovered. You want to keep a close eye on year-over-year data always, and don’t pay too much attention to the week-to-week data. Also, we will have COVID-19 comps with us all the way to mid February of 2022, so be mindful of that.
I believe that a lot of rookie YouTube crash addicts went in on the second half housing crash call in 2021 not knowing that the COVID-19 comps created an unrealistic level. Because of that lack of experience in tracking data, the recent firmness in home sales data must have been a shock to them.
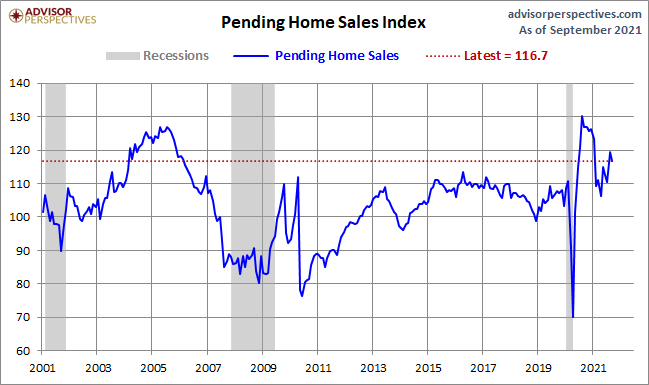
Even the recent pending home sales, which came in as a slight miss, shows how stable housing demand is in 2021. My rule of thumb for the existing home sales market is that if home sales are trending between 5,840,000 – 6,200,000 it’s a good year and for the most part, home sales have been in that range. If anything, I had anticipated more than one sales print under 5,840,000 and we only have three reports left.
One final note with purchase application data. When housing data really get weak, we typically see 18-24 months of negative year-over-year trends. Currently, after making some COVID-19 adjustments, demand is very stable. Stable replacement buyer demand has been my theme for housing in the years 2020-2024 for a reason: people buy homes for shelter, not an investment, and this gives shelter buying top priority that a meme stock doesn’t warrant. I always felt that housing economics gets lost in a sea for investment marketing madness. My job is to guide you through the ebbs and flows of a stable demand market and show you when demand gets too hot. Price growth is way too hot for my taste but it’s not speculative demand.
We are early in the economic expansion and still finding our legs in these new post-COVID waters. I do believe that in the upcoming months I will be able to move on from the early economic expansion language I use and talk about a more mature expansion.
Looking for the next recession
With that theme of a more mature expansion, there are some reliable “usual suspects” to keep an eye on if you want to call the next recession.
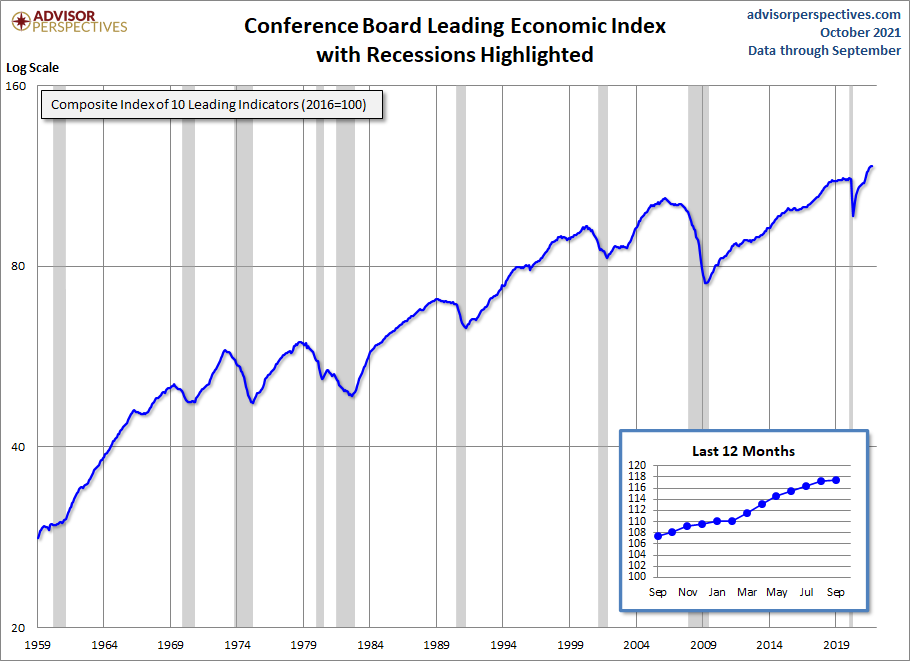
The first is the Conference Board Leading Economic Index. The LEI typically falls 4-6 months before a recession. This didn’t happen in the last recession because COVID-19 was a unique shock to the system. This data line looks extremely healthy currently, so no red flag here.
With most economic data lines, it’s critical to know the component of the index. The leading economic index has a series of data lines that combine to show if the economy is expanding or going into recession and the important data here is building permits. See this article for how housing permits are a key factor.
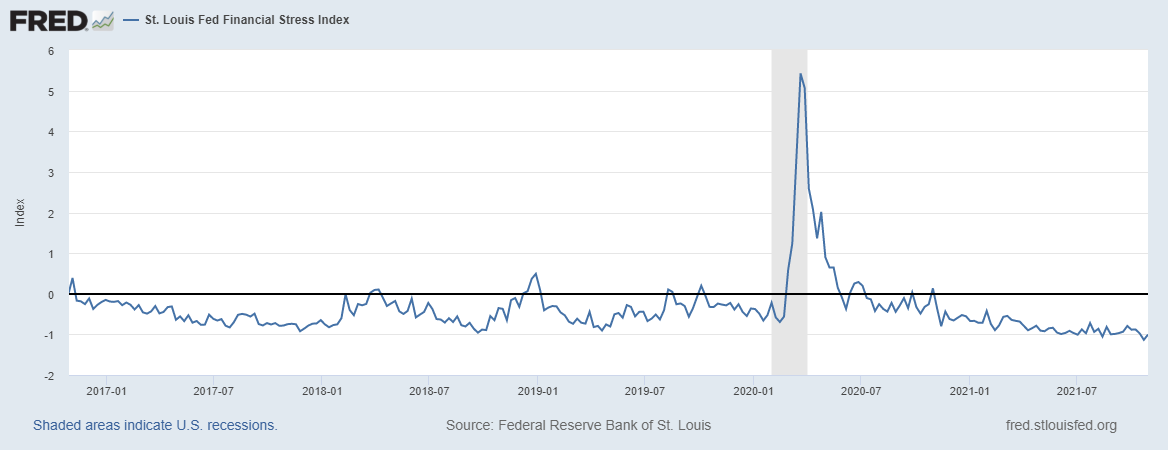
The next indicator, the St. Louis Financial Stress Index, has been asleep for a while now. The black line of zero is considered everyday stress; A recent print showed the index at -1.0052%.
This is too good to last forever, but you can see why the stock market hasn’t had a 10% plus correction since March 2020. Expect more volatility in 2022 compared to what we had in 2021.
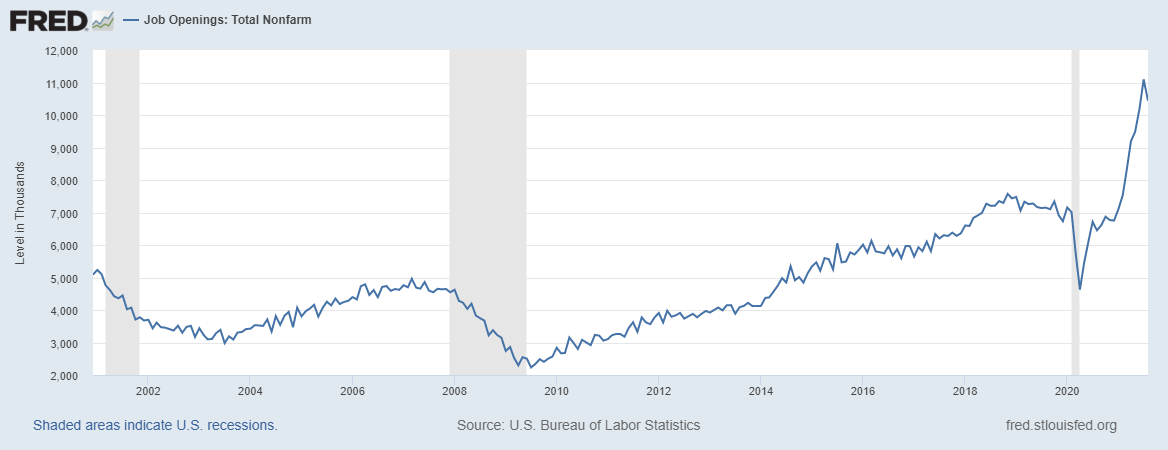
Job openings are our third indicator of economic health. Job openings are over 10 million so we are looking good on that front.
For those who follow me on social media, you are well aware of my constant tweeting of JOLTS 10 million before this economic data line broke out to go above 10 million. This looks very normal to me considering the dynamics of our recovery and the fact that I don’t believe any country has a Dorian Gray labor market. Death and aging are powerful forces in any economy and the Baby Boomers are getting older. There will be a time where this data line will be concerning, but we are nowhere close to those levels yet.
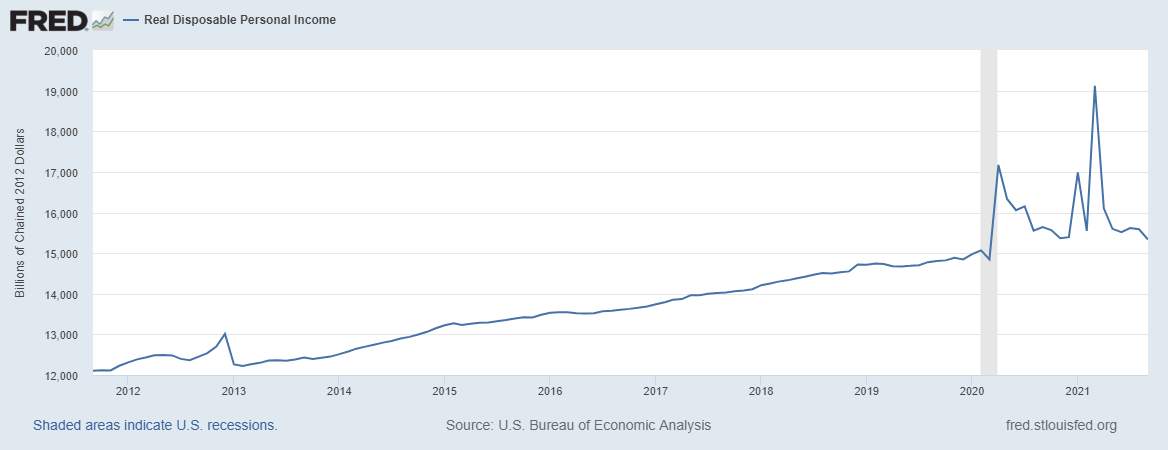
After the disaster relief programs, in which the government gave people money, real disposable personal income took off and then came back to planet Earth. However, we are still at healthy levels today.
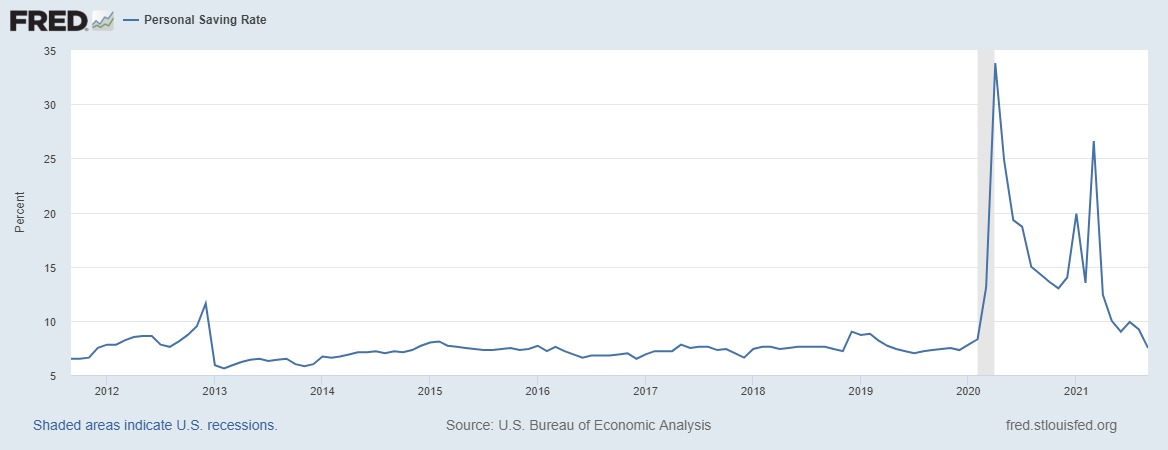
The same can be said with the personal saving rate, where we have gotten back to pre-COVID-19 levels.
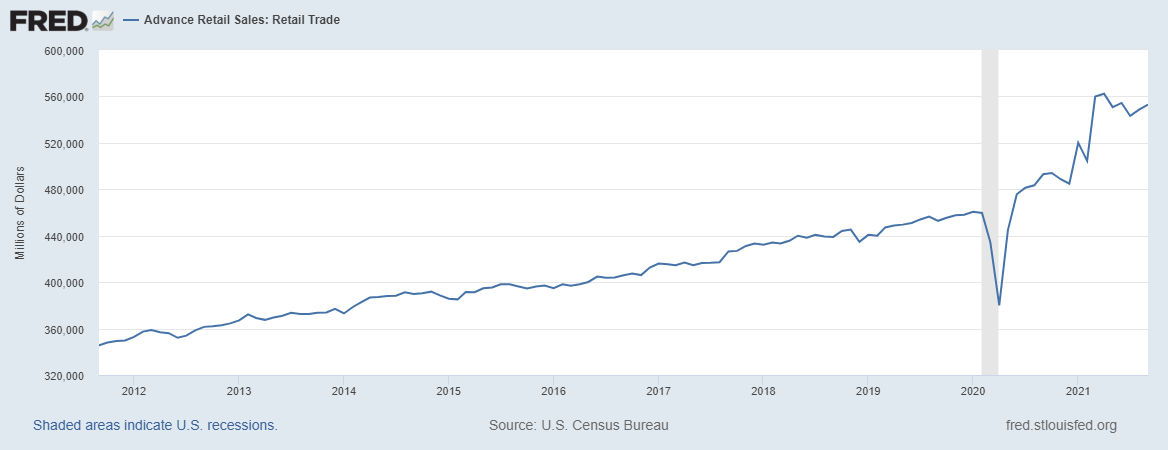
Since disaster relief is tapering, and excess savings have been spent, I do expect retail sales to moderate after their run-up from historical norms.
This Thanksgiving, we can all be grateful for the healthy economy we enjoy after a horrific two years of enduring the pandemic. Although each economic cycle is unique, they share some commonalities so we can forecast what will happen next. Housing supply, mortgage rates, credit availability and the health of the overall economy tell us all we need to know about the future of the U.S. housing market.
If the COVID-19 crisis didn’t happen, we would still enjoy the most prolonged economic and job expansion in history. But the pandemic did happen, and we are more vital for having weathered that horrific storm. We now continue this journey together in this new expansion. Economic cycles come and go: My job is to guide you through this process and show you that boring economic models work. They may not be sexy, but they can be precious when you have a good one tested through time. Trust the data and keep moving forward.


Hi, Logan, Realtor here. I started reading Housing Wire because of your writing. It’s terrific. I am learning so much. So smart. I take what I learn and post your article w/ a video of mine and then overlay local stats. It’s super helpful for me and for the consumer. Thank you!
You’re most welcome. Also, starting next week, Sarah W. and I will be doing weekly podcast interviews to go over all the housing stories and economic data.